To-Do List
- code update: to-do list (12/18)
- get ratio figures online (12/18)
- add description to ratio figs (12/18)
- notable progress on 'Results' (12/19)
- finish ModYY description (12/20)
06/01-06/05
NOTE: There is an update (06/04) at the bottom of this page.
Website Updates
I have fixed LaTeX display on the site and re-added the lightbox effect to images. From now on, clicking on most images will open them in a separate display, and clicking on the left/right side of that display will move to the previous/next image in the image set.
Boundary Transition
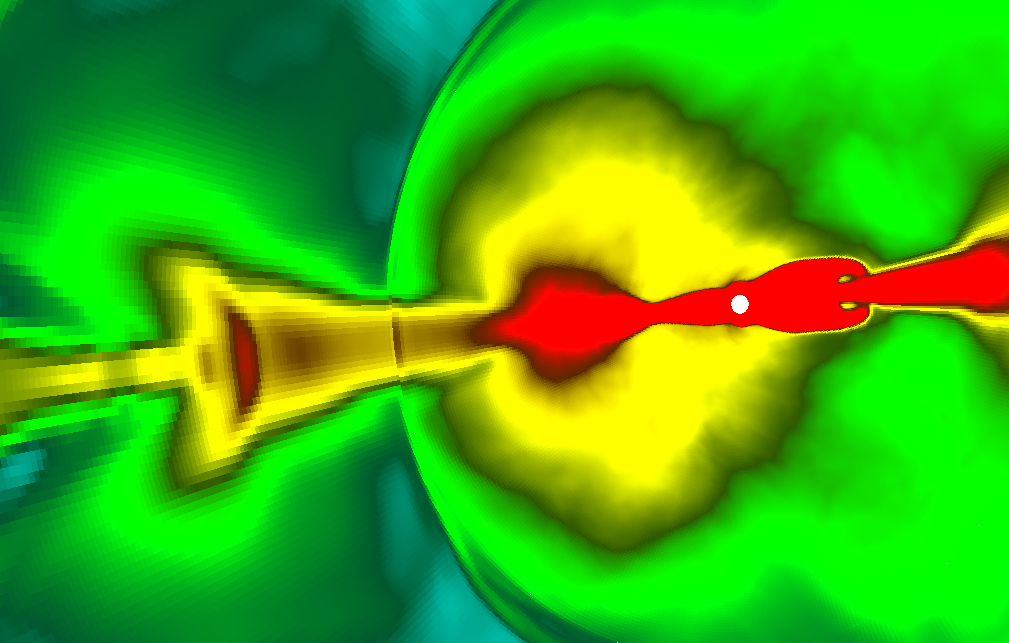
Density after one orbit
The artifact that appears at the grid boundary is still present in high-resolution when $\text{zxc}_i(\text{imax}) < \text{zxc}_o(1)$.
I will upload low-resolution results later today.
Density Jump
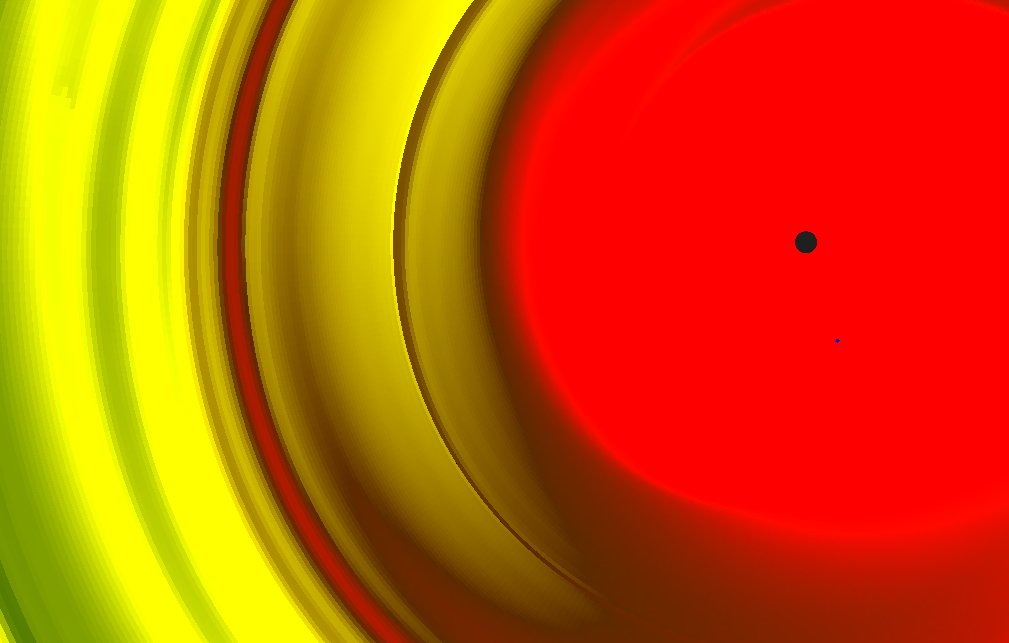
Pressure after one orbit
Isosurface showing the discontinuity
A discontinuity is present when switching between the inner grid (blue) and outer grid (orange). This discontenuity does not seem to impact structure, however.
Further Investigation
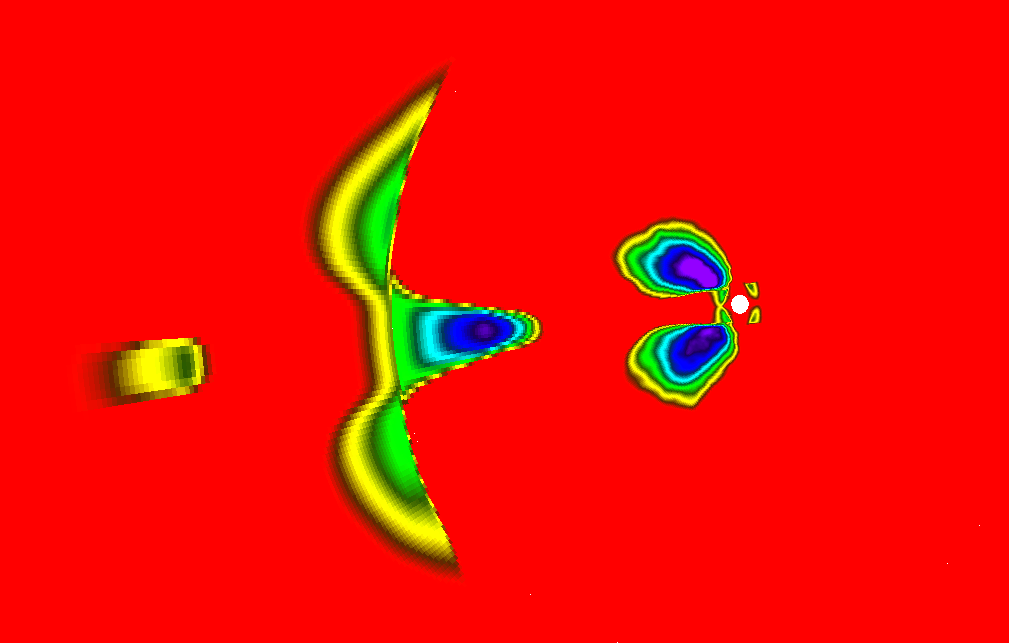
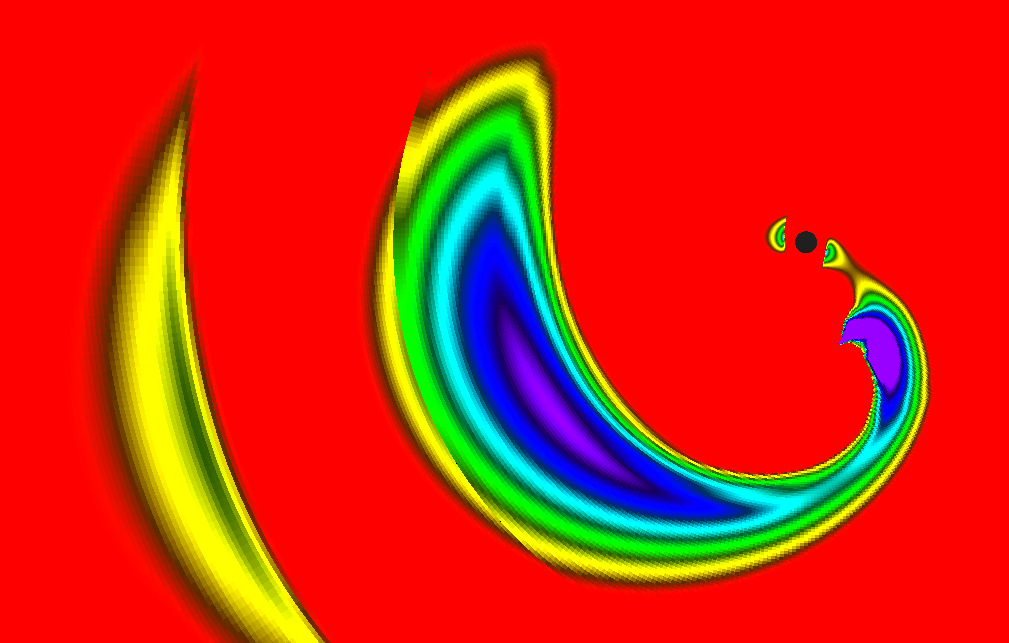
The following images are from a completed run with slightly different parameters.
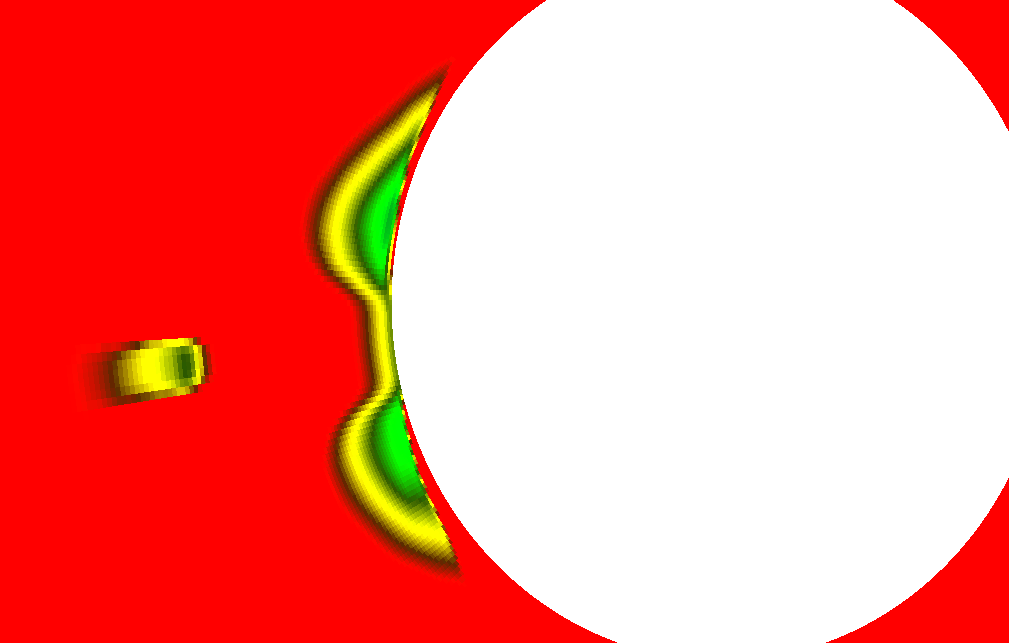
Velocity (negative only, $\geq 0$ is red), viewed at the same angle as above. Inner grid has been removed.
To Do:
- print inner boundary in EnSight format, make sure it matches up with both the inner and outer grid
- output forces on each grid, plot as above
- if nothing is discovered, put together detailed explanation, EnSight files for John


