To-Do List
- code update: to-do list (12/18)
- get ratio figures online (12/18)
- add description to ratio figs (12/18)
- notable progress on 'Results' (12/19)
- finish ModYY description (12/20)
10/11 - 10/15
Azimuthal Averaging
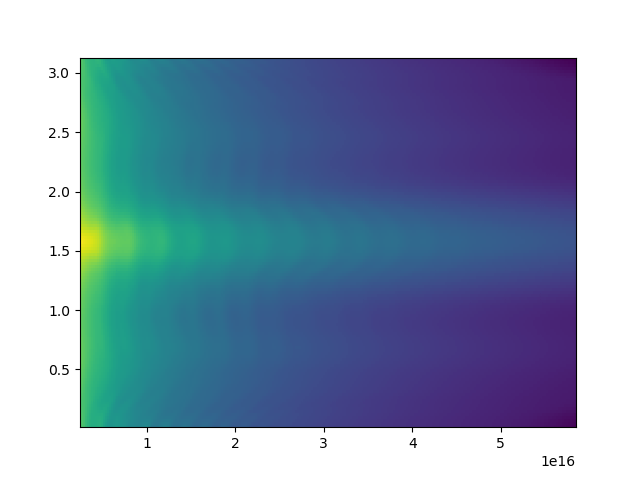
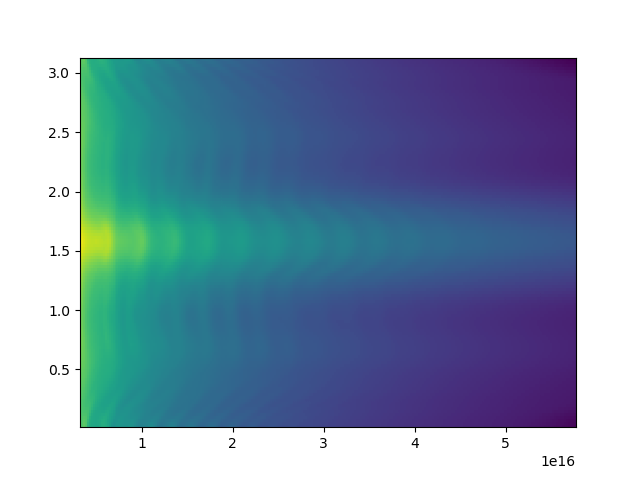
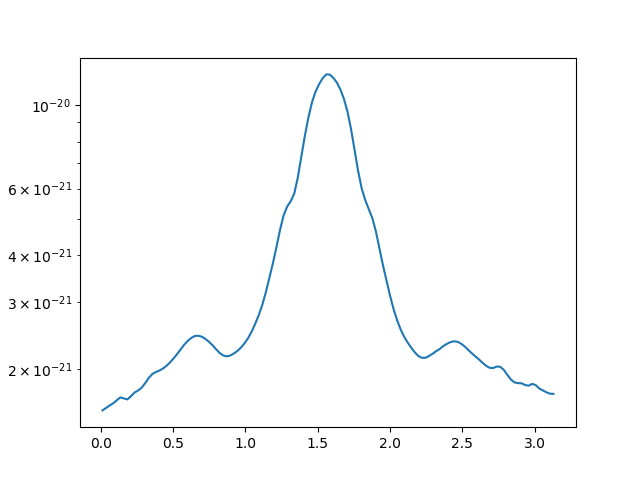
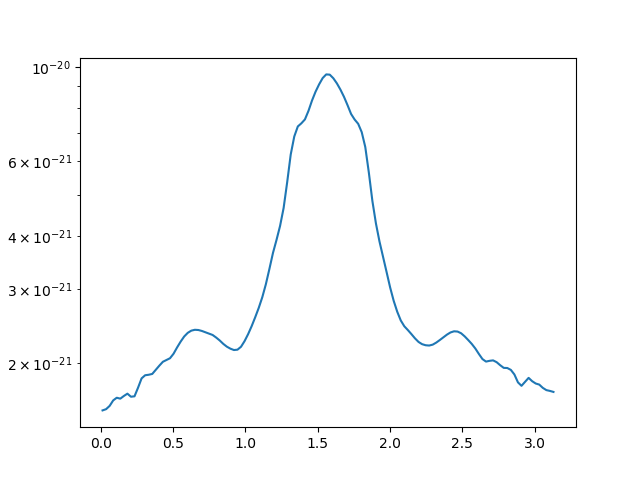
I decided to look into the local minima/maxima seen when azimuthally averaging by comparing average about the orbital axis (CM) vs. the grid axis.
I would not expect these to look different (and they don't), since an integration over $2\pi$ would hit one section of the spiral in either case (except maybe at the poles).
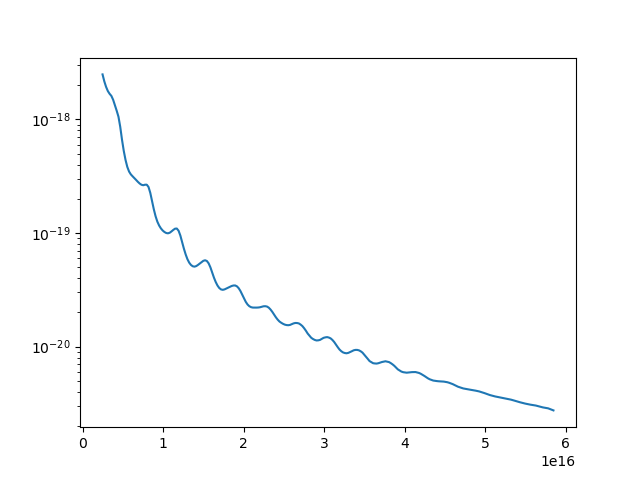
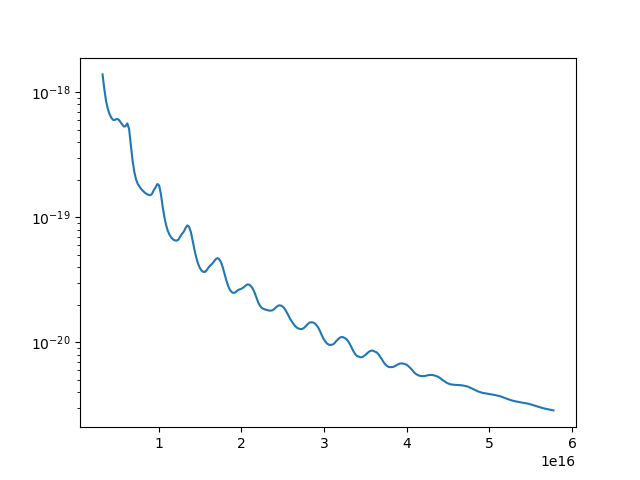
Here is a profile at the same radius:
The averaged profile for the equatorial plane:
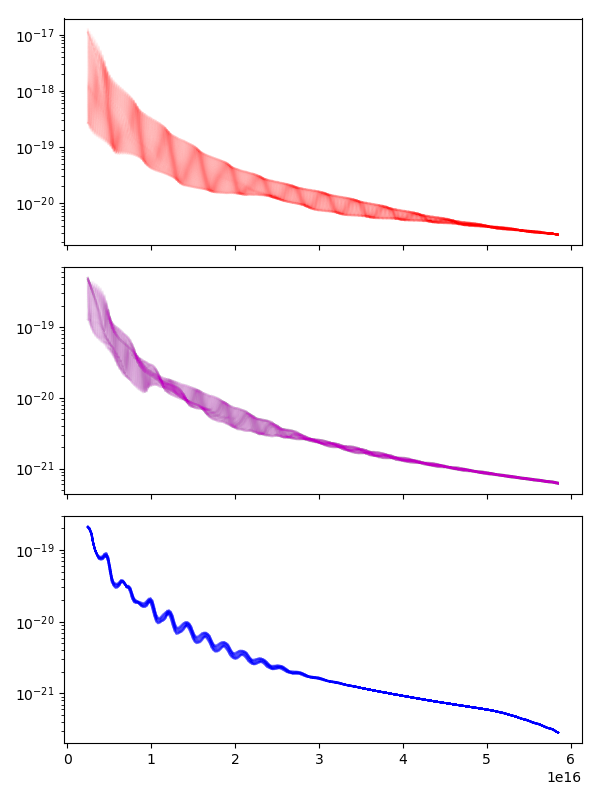
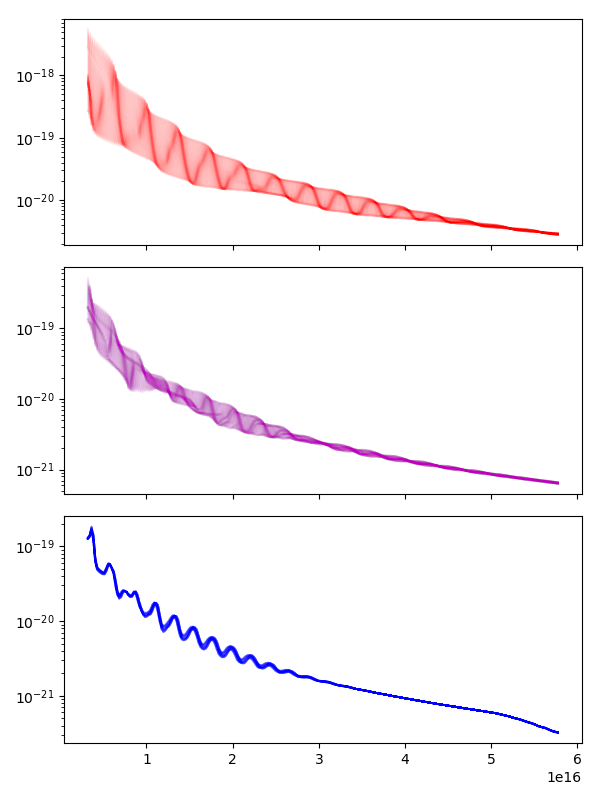
Profile at every $\phi$ for the equatorial plane, a 45 degree angle, and the polar axis. Note averaging about the orbital axis (right) enhances the 'overlap' between the profiles.
