To-Do List
- code update: to-do list (12/18)
- get ratio figures online (12/18)
- add description to ratio figs (12/18)
- notable progress on 'Results' (12/19)
- finish ModYY description (12/20)
09/06 - 09/10
Thursday Update
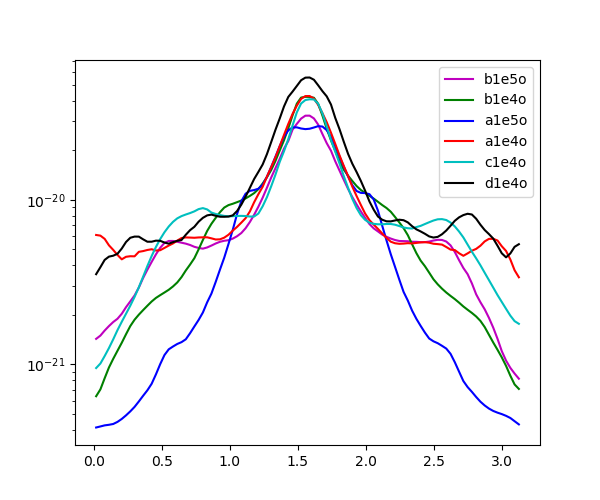
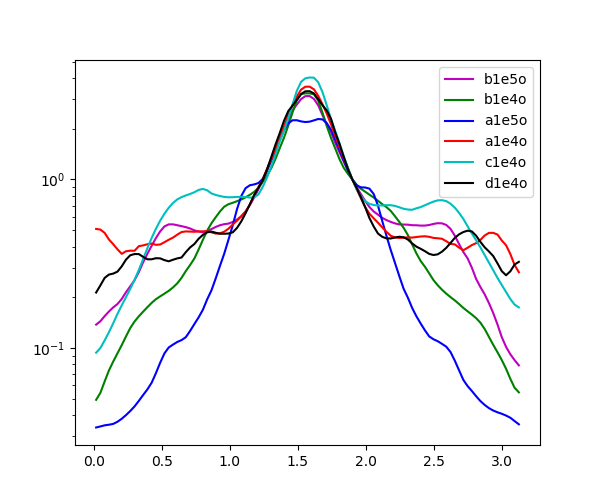
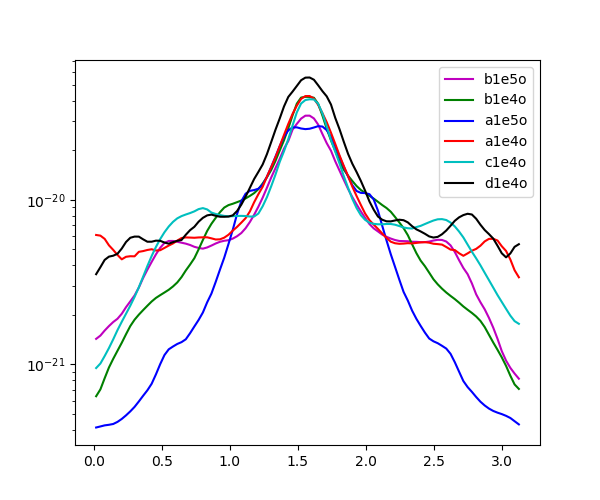
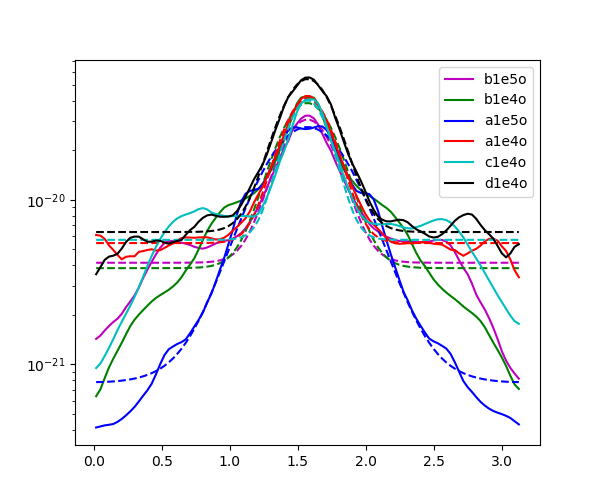
Outer Grid Profiles
As seen in the third plot, slope prior to the wing region is unaffected by wind conditions close to the binary - even if mass is removed and density is lowered.
Contrast Ratio
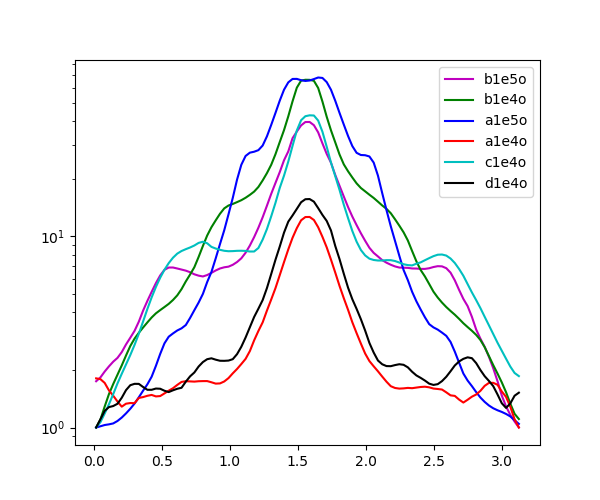
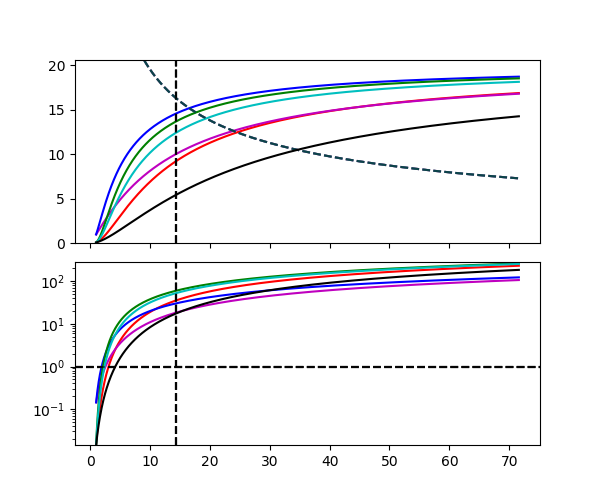
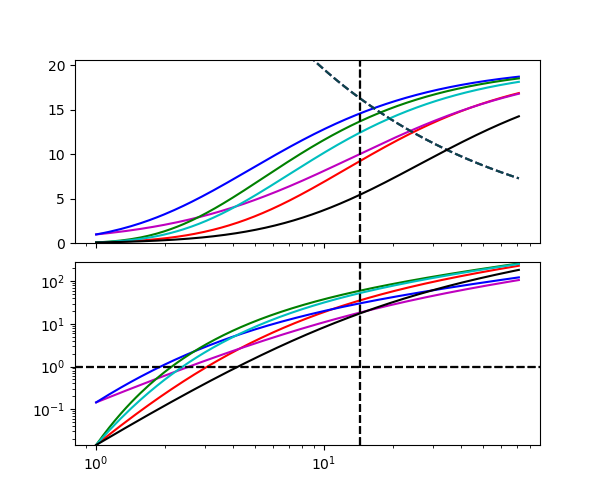
Contrast ratios using three different methods
   run    |   m0   |   m1   |   m2
   b1e5o  -  39.6  -   7.4  -   6.8
   b1e4o  -  65.9  -  10.0  -  14.0
   a1e5o  -  67.7  -  35.4  -  24.1
   a1e4o  -  12.6  -   7.5  -   7.6
   c1e4o  -  43.0  -   7.0  -   6.3
   d1e4o  -  15.6  -   8.4  -   8.4
m0: high_value / low_value
m1: fit to $$\rho(\theta) = C - A \frac{\exp\left(-2\beta \cos^2 t\right)-1}{\exp\left(-2\beta\right)-1}$$
m2: the ratio of average densities $\bar{\rho}_{d_1} / \bar{\rho}_{d_2}$ of two solid angles $d_1$ and $d_2$ where $$d_1 = 0.1 = \int_{\frac{\pi}{2}-\alpha}^{\frac{\pi}{2}} \sin\theta\ d\theta; \alpha=\sin^{-1}(d)$$ and $$d_2 = 0.3 = \int_0^\beta \sin\theta\ d\theta; \beta=\cos^{-1}(1-d)$$
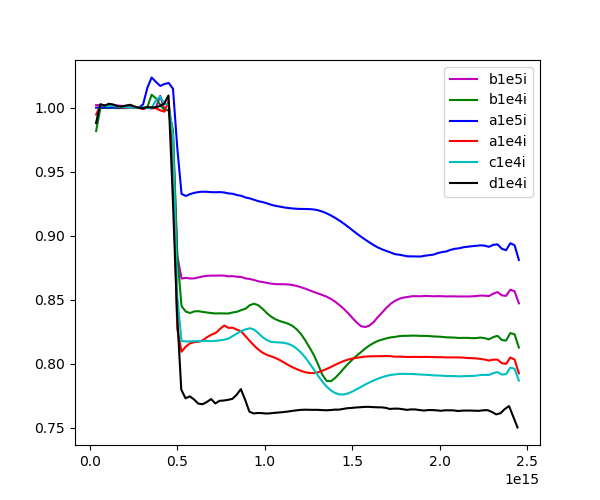
Altering Wind Profiles
All profiles use the following equation: $$u(r) = v_\infty (1+R_c/r)^{-\beta}$$
