To-Do List
- code update: to-do list (12/18)
- get ratio figures online (12/18)
- add description to ratio figs (12/18)
- notable progress on 'Results' (12/19)
- finish ModYY description (12/20)
12/15-12/19
Highlights
After fixing the strange axis issue, there are some clear trends using the Blondin eq. (see below).
Data Viewer
This has been updated to include all (low-res) runs.
NOTE: The plots below are interactive.
Some Analysis
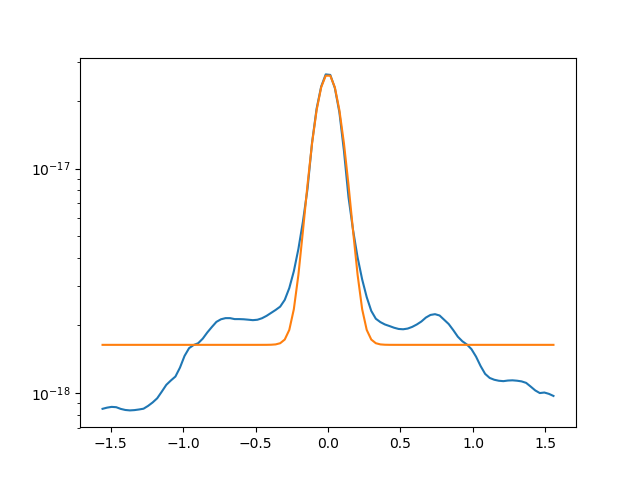
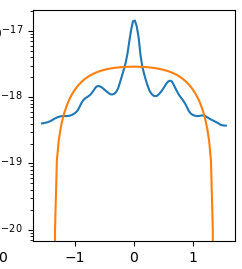
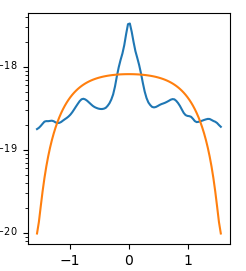
Method 1. Density contrast taken from Blondin paper $$\rho(\theta) \sim C - A \frac{\exp\left(-2\beta \cos^2\theta\right)-1}{\exp\left(-2\beta\right)-1}$$


Fig. [left] Example fit of data (blue) to Blondin eq. (orange). [right] Example of failed fit.
Method 2. We consider average density at the poles out to some angle $\alpha$, such that the solid angle about the range $\theta:(0,\alpha), \theta:(\pi-\alpha,\pi)$ is a fraction $d$ of the total surface of the sphere. i.e., $$ d = \int_0^\alpha sin(\theta)\ d\theta \to \alpha = \cos^{-1}\left(1 - d\right) $$ Data is stored as $\rho(\theta)$, so average density over this area is $$ \frac {\sum_i^{\theta_i < \alpha} \rho(\theta_i) \left[ \cos(\theta_i-\delta) - cos(\theta_i+\delta) \right] } {\sum_i^{\theta_i < \alpha} \cos(\theta_i-\delta) - \cos(\theta_i+\delta) } $$ Current contrast values are generated using a minimum found with $d=0.3$ and a maximum found using a similar process to capture a $d=0.1$ surface about the equatorial plane.
For the plots below, color key is listed above each figure. All (incorrect) negative datapoints have been removed. For each section, top uses method 1 (Blondin Eq.), bottom uses method 2 (solid angle).
$v_{orb}/v_{wind}$ - 1.0 (red) - 1.5 (green) - 2.0 (blue)


$v_{wind}$ - 15 (red) - 20 (green) - 25 (blue)


$v_{orb}/v_{wind}$ - 1.0 (red) - 1.5 (green) - 2.0 (blue)


$M_2/M_1$ - 1.0 (red) - 1.5 (green) - 2.0 (blue) - 2.5 (black)


$v_{wind}$ - 15 (red) - 20 (green) - 25 (blue)


$M_2/M_1$ - 1.0 (red) - 1.5 (green) - 2.0 (blue) - 2.5 (black)


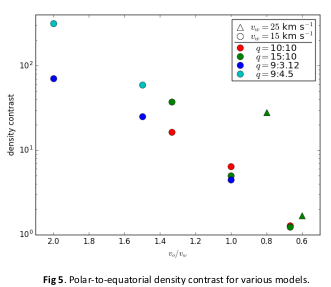
Fig. Density Contrast as a function of $v$ ratio from earlier research, using the fit $$\rho(\theta) \sim \exp\left(-\theta/\theta_0\right)$$


