Vela X-1 Wind Accretion Project
An overview of the work I am currently doing with the Blondin Research Group
Vela X-1
A high-mass X-ray binary (HMXB) is a close binary system that consists of two stars that are gravitationally bound, one of which is a white dwarf or neutron star (or more rarely a black hole) and is accreting matter from what is usually a main-sequence star that has a mass greater than ten solar masses. The companion is generally an O or B type star, emitting a stellar wind driven by radiation pressure. In the case of Vela X-1 the companion star is a blue supergiant and the primary star is a neutron star. Mass transfer to the neutron star or black hole does not proceed via Roche-lobe overflow into an accretion disk, as is the case for a low-mass X-ray binary, but rather through the capture of this stellar wind directly onto the compact object. Roche-lobe overflow occurs when the teardrop-shaped space that defines the region where the material is bound to the star by gravity becomes too full. Depending on its initial location, energy, and momentum, the material pushed outside the Roche-lobe of a star may either escape the system completely, orbit both stars or fall onto the binary companion. However, in our case, we investigate wind accretion, which happens by the gravitational capture of stellar wind coming off the main-sequence star by the compact object, rather than mass from Roche-lobe overflow.
3D Results
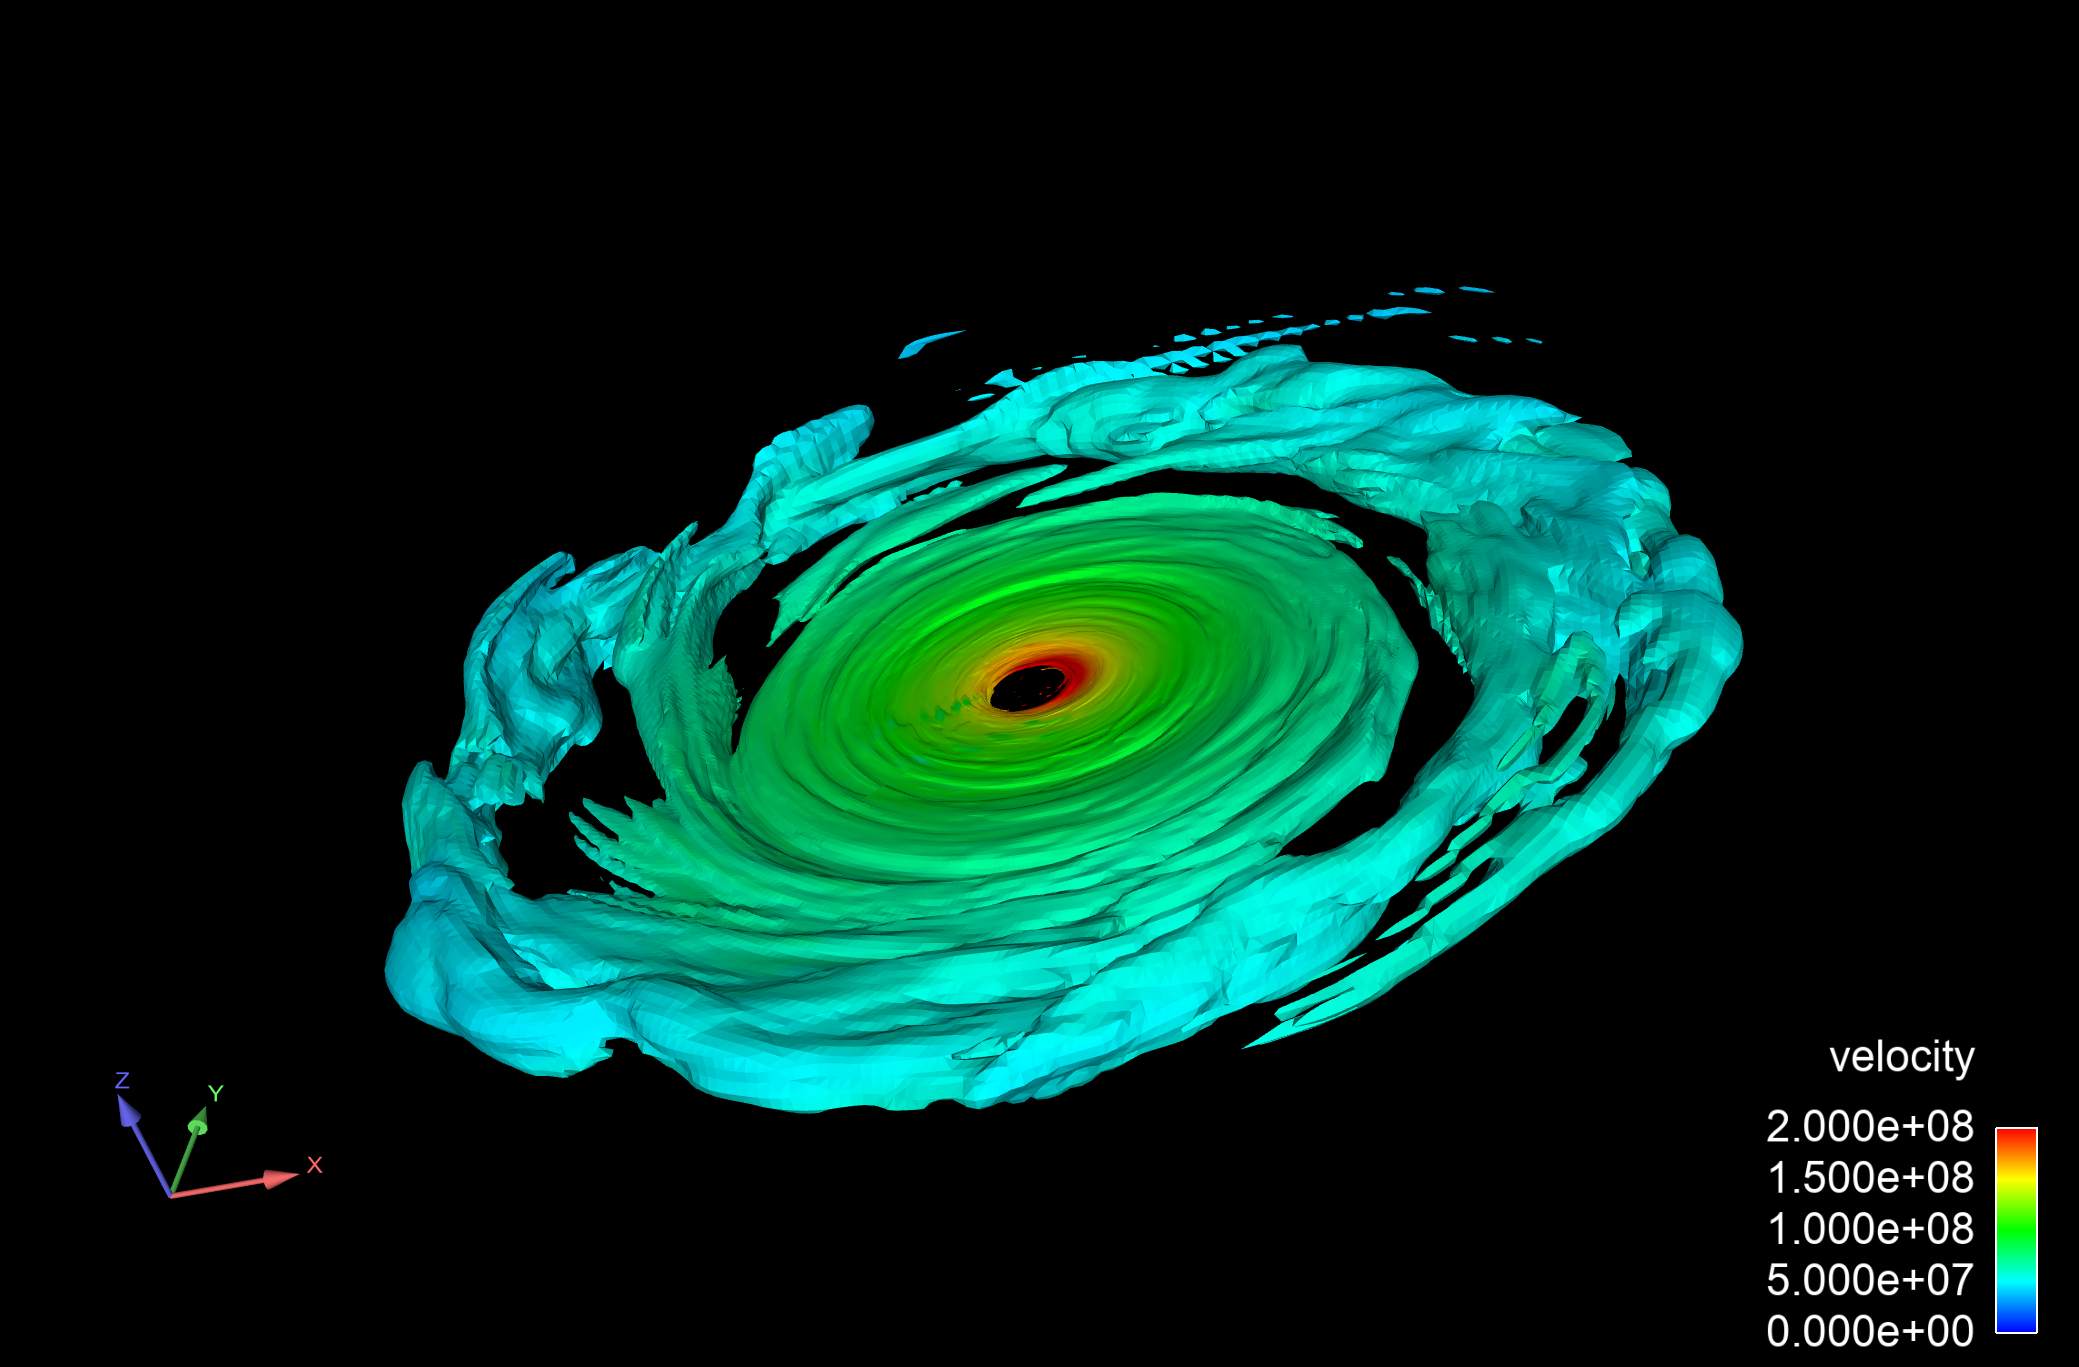
Here are some images of the results of the 3D Vela X-1 Simulations. Shown is the results of the wind flow onto the accretor. The first image shows the Deep (spherical) Roche Lobe Companion star geometry with the fast wind speed. This model closely resembles the typical Bondi-Hoyle-Lyttleton accretion as can be seen in the defined bow shock. The other two images show the accretion disks formed by the Close (full) Roche Lobe companion star geomtry with the fast and then slow wind speed. These results follow out prediction that wind coming off a star with a more full Roche Lobe would be more likley to form an accretion disk. You can see that for the slow wind run that the wind in the accretion disk seems to be rotating faster than the wind in the fast wind run, which might be due to more gained angular momentum.


Companion star in 3D!
These are some finsihed star 1 (companion star) runs in 3D! These were run using the fast wind profile with a deep, intrm, and close Roche Lobe geometry. The slow wind runs are still being run. Note the difference in scale.


Past 2D Runs - On the Path to 3D
These new models below are 2D models of Vela X-1 using the Sobolev Force to alter the wind speed. While in past works Vela X-1’s windspeed was thought to be “fast” around 1200 km/s, more recent observations andtheory suggests a “slow” windspeed of around 600km/s Sander et al. (2018). It was therefore decided to investigatethe effects of slow, intermediate, and fast wind profiles grouped by having a filled or unfilled Roche Lobe on the winddynamics of Vela X-1 with careful attention on the possible formation of an accretion disc around the neutron star. The small pictured models below show streamlines of the wind’s velocity vectors colored by velocity overa density colored background. The Note the high density near the L1 point and the relatively low density outside of it. 3D Models with more visualization on the neutron star coming soon :)
These are run with a less full Roche Lobe level and increasing speed with slowest on the left and fastest on the right.


These are run with a more full Roche Lobe level and increasing speed with slowest on the left and fastest on the right.


Past Work
This first image is a picture of a high density cloud (in red) we put into the 3D Yin Yang code that is modeling a supernova. Learning how to do this will help us to accurately model clumpy winds if neccessary in the future.

This second image is a screen shot of the phi component of velocity after, in the 3D Ying Yang code modeling an accretion, we added corotational forces into the code, to make the accretion have angular momentum, which is more like what happens in a real accretion.

This is an image of the old Vela X-1 wind velocity model we used when first starting research. Come to find out this model was not physically correct, so now shown in the images abpve we use the Sobolev force model.

Notes
My notes on the projects I am currently working on
Vela X-1 (Current Project)
We are currently working on analyzing some 3D Models based on the past 2D models (graphs for the 2D models can be found below). We have choose to run 6 different models based on 3 different Roche Lobe geometries (Deep, Intrm, and Close) and two different wind speeds (Slow and Fast). We have finihed the 3D models and are now working on analyzing and writing a 3D Vela paper
3D Accretor Analysis: Mass Flux and Angular Momentum Mollweide Projections
These graphs show the Mass Flux Mollweide Projections around the primary star at a radius of 3e12 (binary seperation 3.687e12) for the Close Fast, Close SLow, and Intrm Slow runs respectively. The white/blank angular regions shown have no mass flux or angular momentum. As you can see, there is a significantly more amount of mass flux for the more full Roche Lobe geometries which shows that more mass is being captured by the neutron star for the Close Roche Lobe geometry runs. Additionally, in the slow wind runs there is significantly more mass flux concentrated not just in the center of the projection but in the equator as well. As for angular momentum, between the slow and fast runs there seems to be more angular momentum for the fast runs


3D Companion Star Models: Mass Flux Mollweide Projections
These graphs show the Mass Flux Mollweide Projections around the companion star at a radius of 3e12 (binary seperation 3.687e12) for the Deep Fast, Intrm Fast, and Close Fast runs respectively


Mollweide Projection Analysis
These graphs show the x-axis and y-axis line plots from each of the mass flux Mollweide Projections.


Comparing 2D and 3D Models
Once we ran our first round of basic 3D runs, we wanted to make sure that the 3D Runs at least somewhat aligned with our 2D results, since we ran the 3D with the same wind profiles and Roche Lobe geometries as the 2D runs. Obviously the introduction of a 3rd dimension will result in some differences in the data between the same 2D an 3d runs, but we found them to be pretty well aligned. These graphs show the "Full" (or Close) Roche Lobe, with the fast wind. The first shows the angle of flow, the second shows the column density and the third shows the density. As you can see, they are quite similar.


2D Models: Density Graphs
These graphs show the log of the density for the different 2D models with differing wind speeds and Roche Lobe levels.


2D Models: Angle of Flow Graphs
These graphs show the angle of flow for the different models with differing wind speeds and Roche Lobe levels.


2D Models: Column Density Graphs
These graphs show the column density for the different models with differing wind speeds and Roche Lobe levels.


