PHEONIX Sythetic Spectra Project
Overview of the research I am doing with NASA Goddard's Exoplanet and Stellar Astrophysics Lab
The search for correlations between stellar parameters and Mg II chromospheric emission lines
A star’s primary energy source lies deep in its center, where temperatures of millions of degrees enable nuclear fusion of hydrogen into helium. The energy created by fusion is carried out to the photosphere, where gas temperatures decrease to thousands of degrees. With increasing altitude above the photosphere, the gas temperature continues to decrease but then starts to increase in a layer called the chromosphere. Observations of Mg II are critical for understanding stellar chromospheres and transition regions, modeling photochemistry in exoplanet atmospheres, and measuring the abundance of ionized magnesium in the interstellar medium. The MgII doublet is one of the strongest features in the NUV spectrum of main sequence stars. Therefore, MgII is a useful diagnostic because of the intrinsic brightness of the emission lines. In order to find a correlation between Mg II self-reversal and stellar parameters, I have been computing synthetic spectra computed with the PHOENIX atmosphere code for a set of 142 main sequence stars with archival Mg II observations. These stars do not have well constrained stellar parameters (Teff, log(g), and [Fe/H]), with literature values of Teff ranging by up to +/- 2000 K. I compare synthetic photometry of models computed with a range of Teff, log(g), and [Fe/H] to archival photometry of the star and use a χ2 test to determine which model is the best match to the observed data. With these newly refined and consistently determined photospheric stellar parameters, we look for correlations with the chromospheric Mg II lines.
The Effect of Stellar Parameters on PHOENIX Spectra
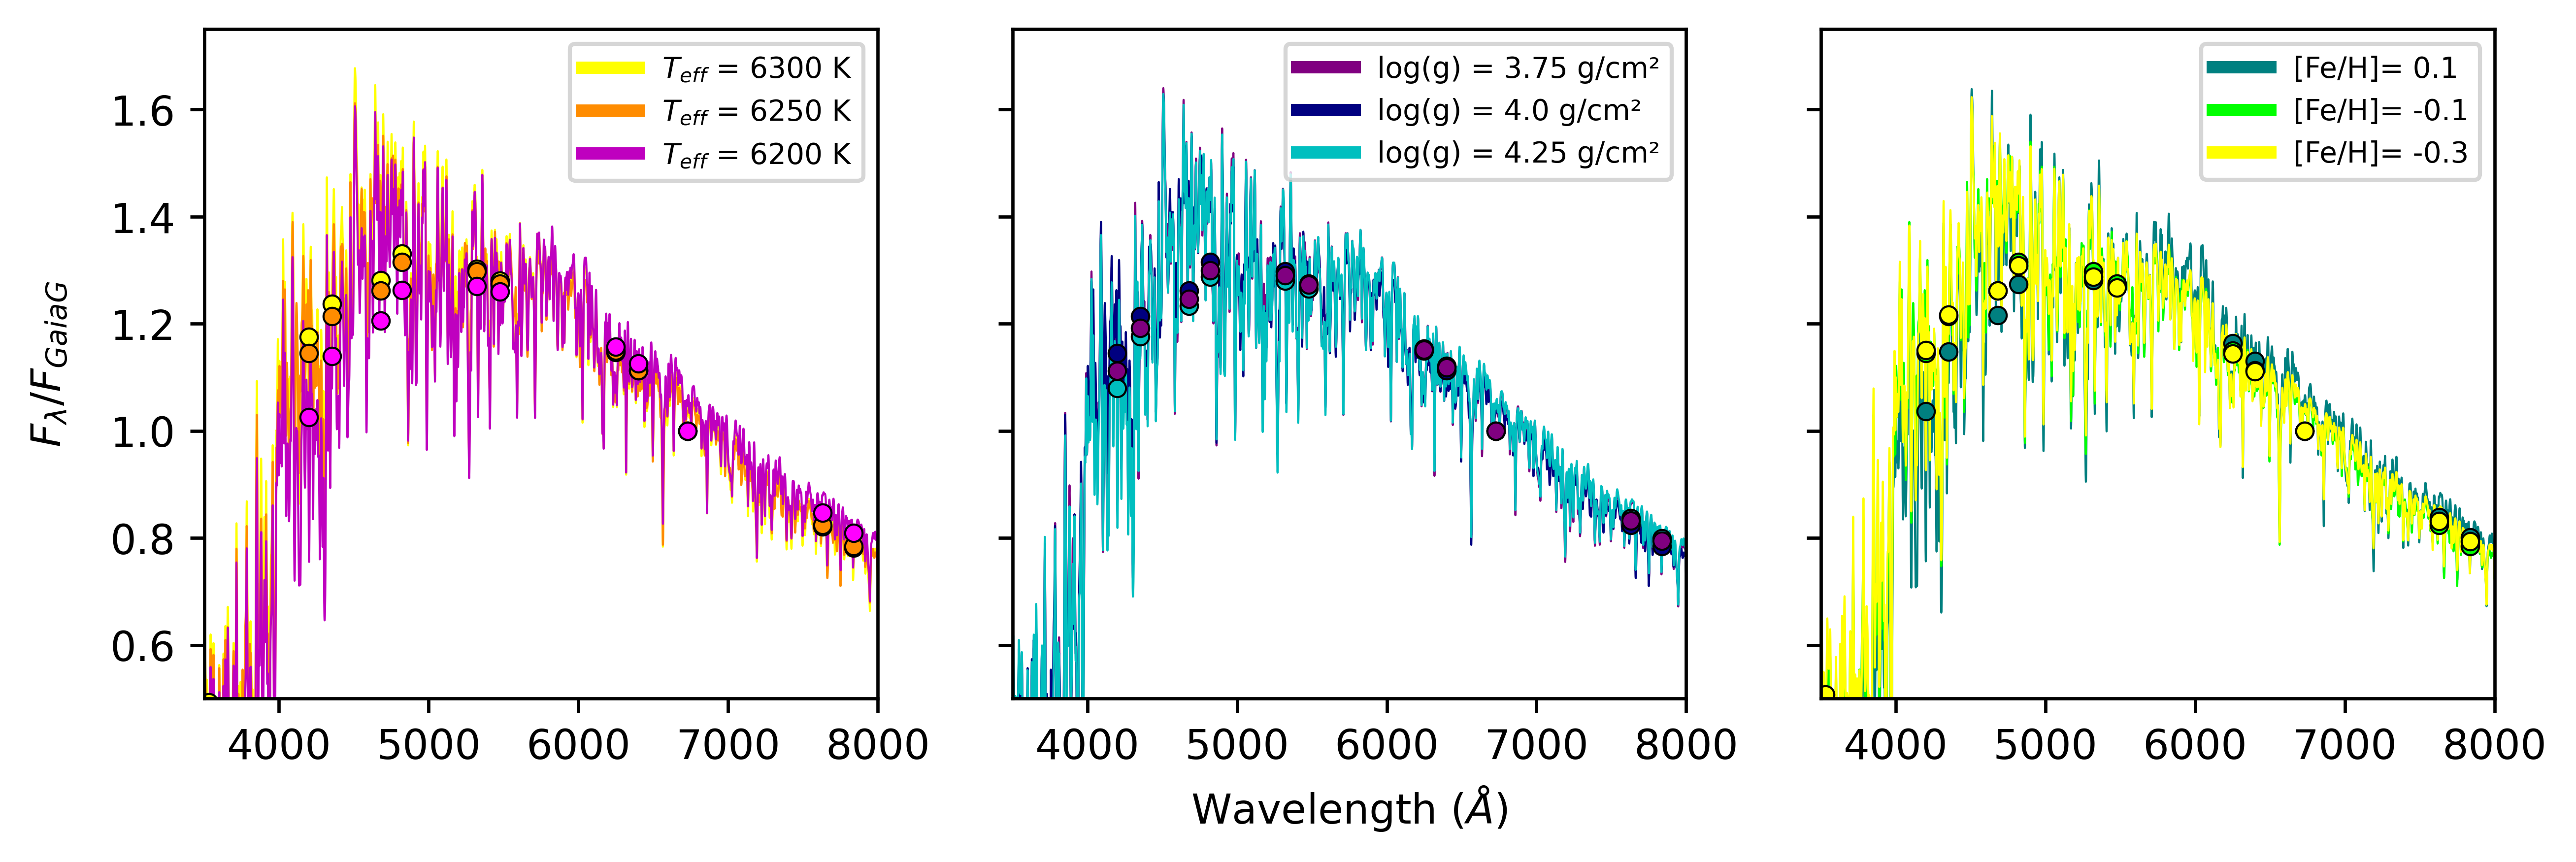
In understanding how to refine stellar parameters with the PHOENIX atmospheric code, it is important to understand how particular stellar paramters effect the overall shape of the spectra. Below are Three different spectra models with computed photometry of HD22409. The first plot is shown with changing the effective temperature by 50K. The second plot is shown with changing the log by .25 dex. The third plot is shown with changing the metallicity by 0.2. These plots reflect the extend at which changing a particular stellar parameter by a relatively small amount effects the overall shape of a model spectra and photometry.
Adding and Upper Atmosphere to the Spectra
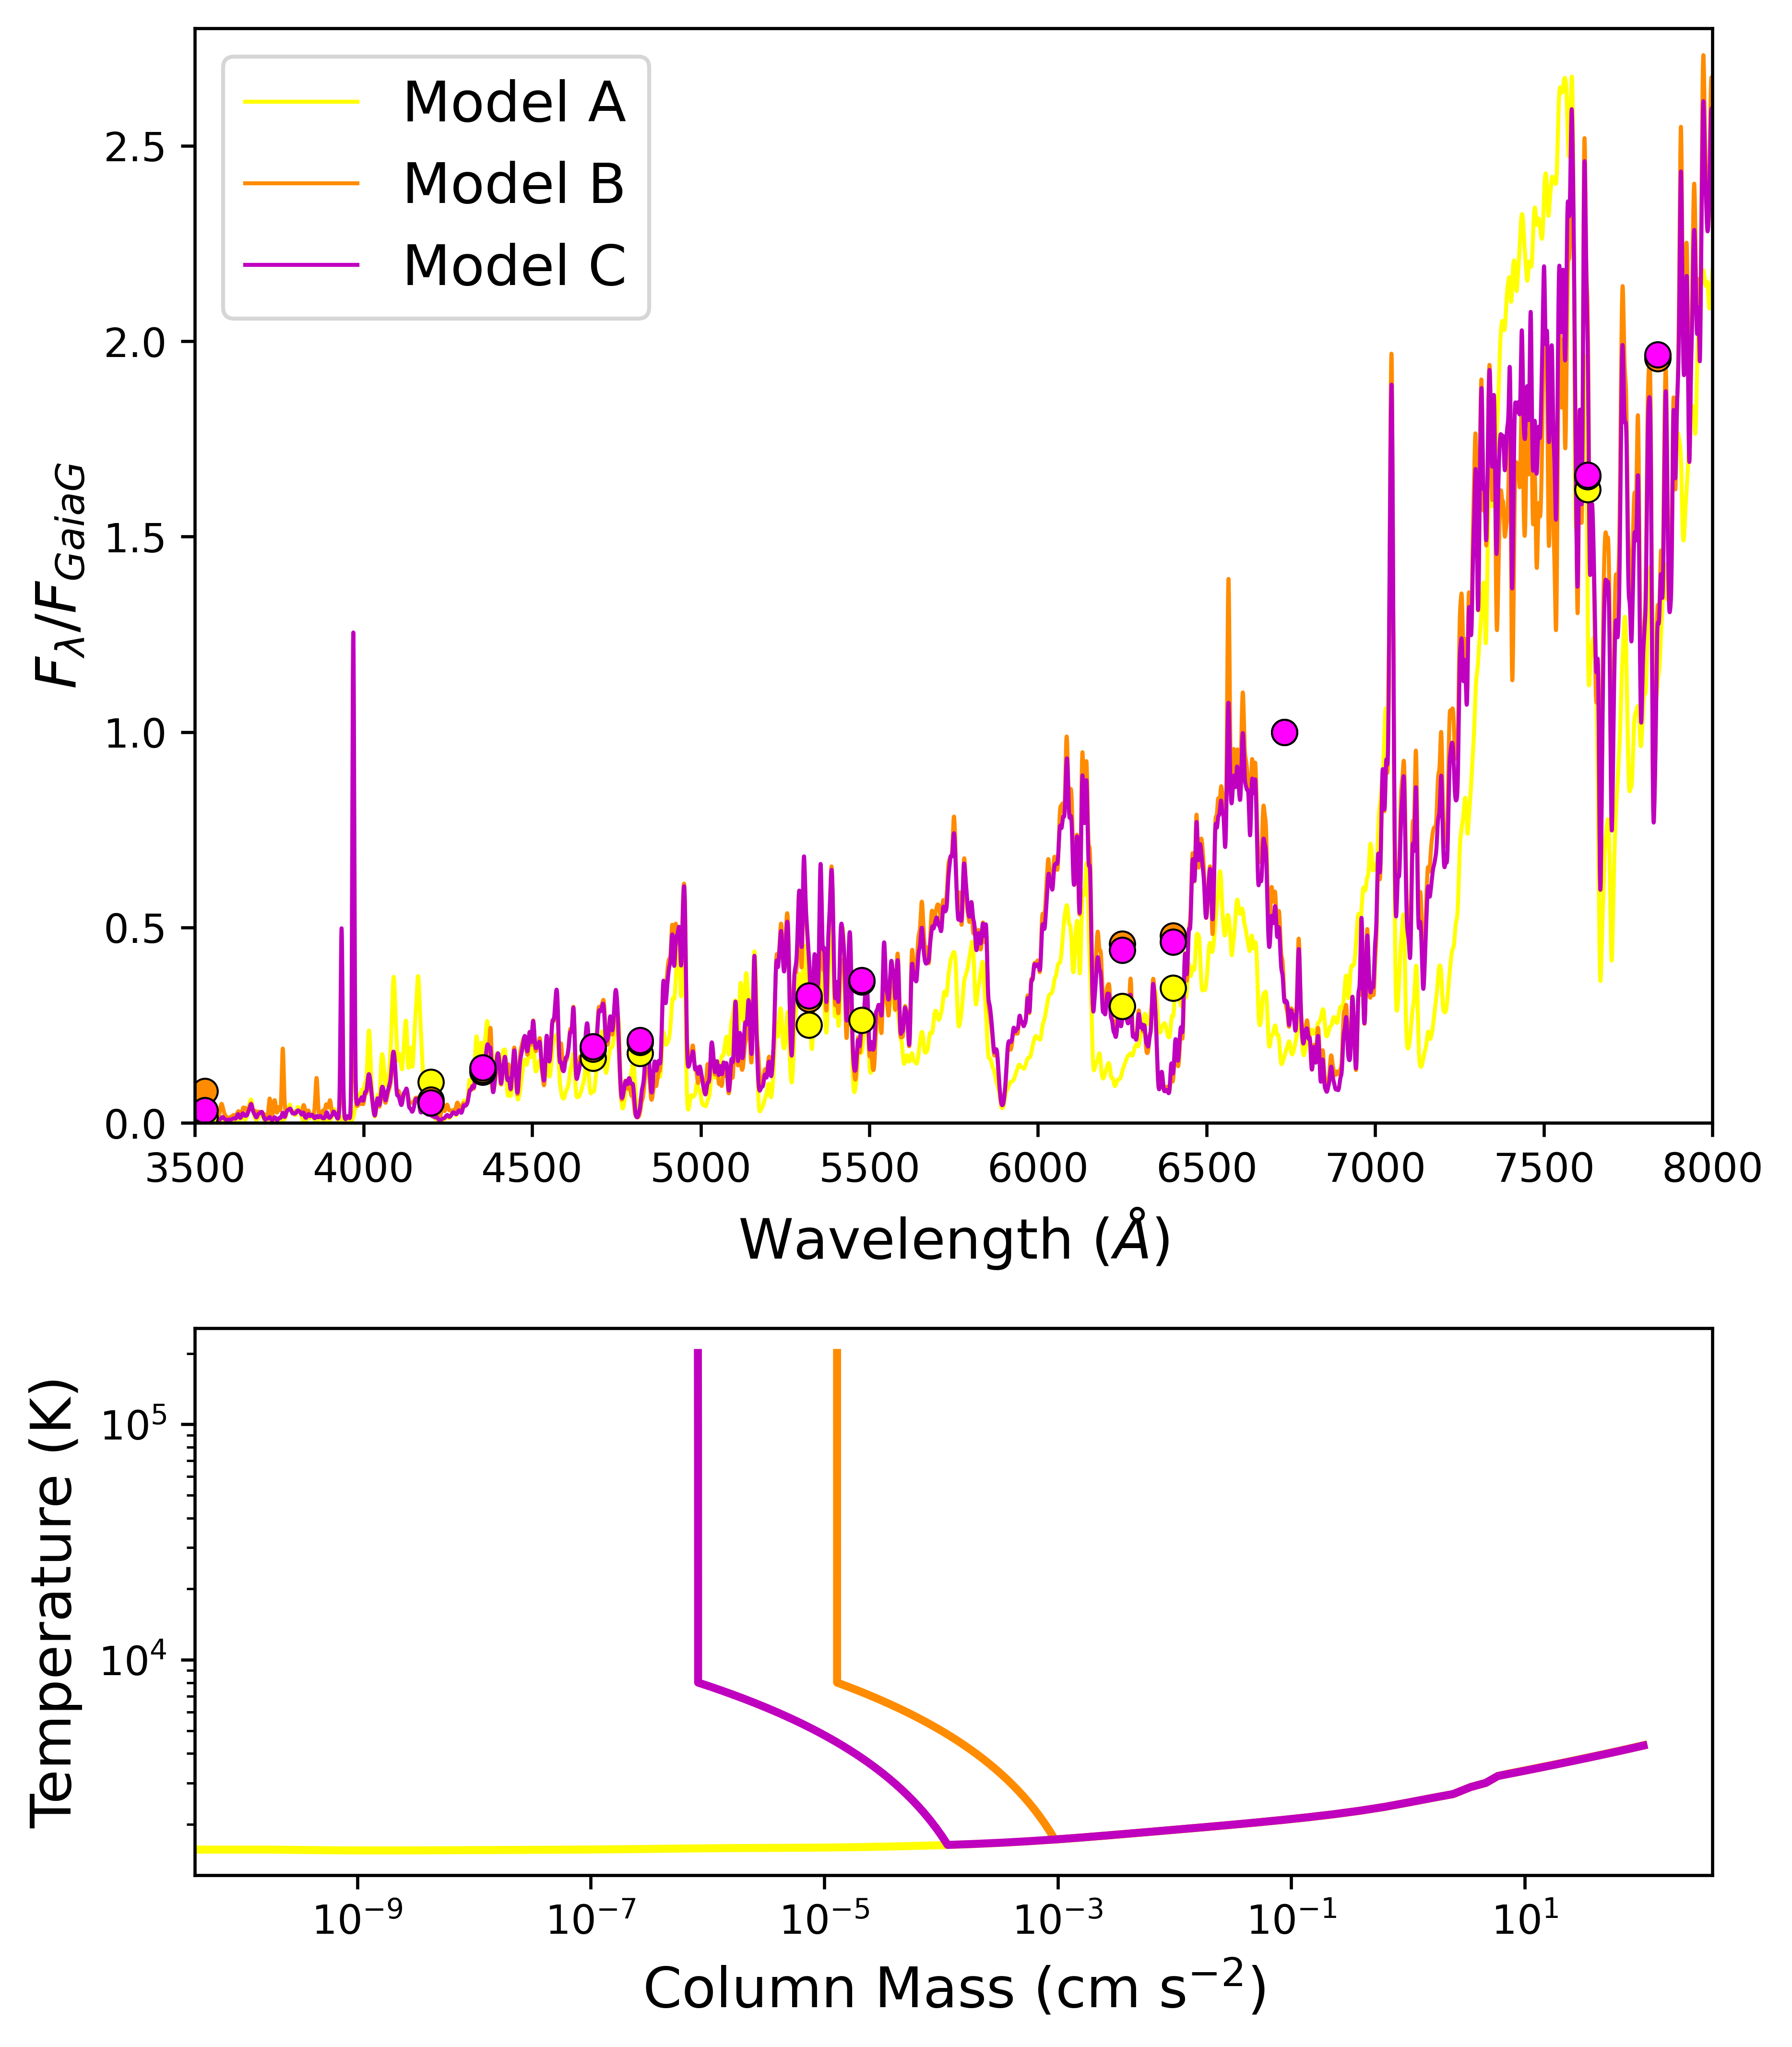
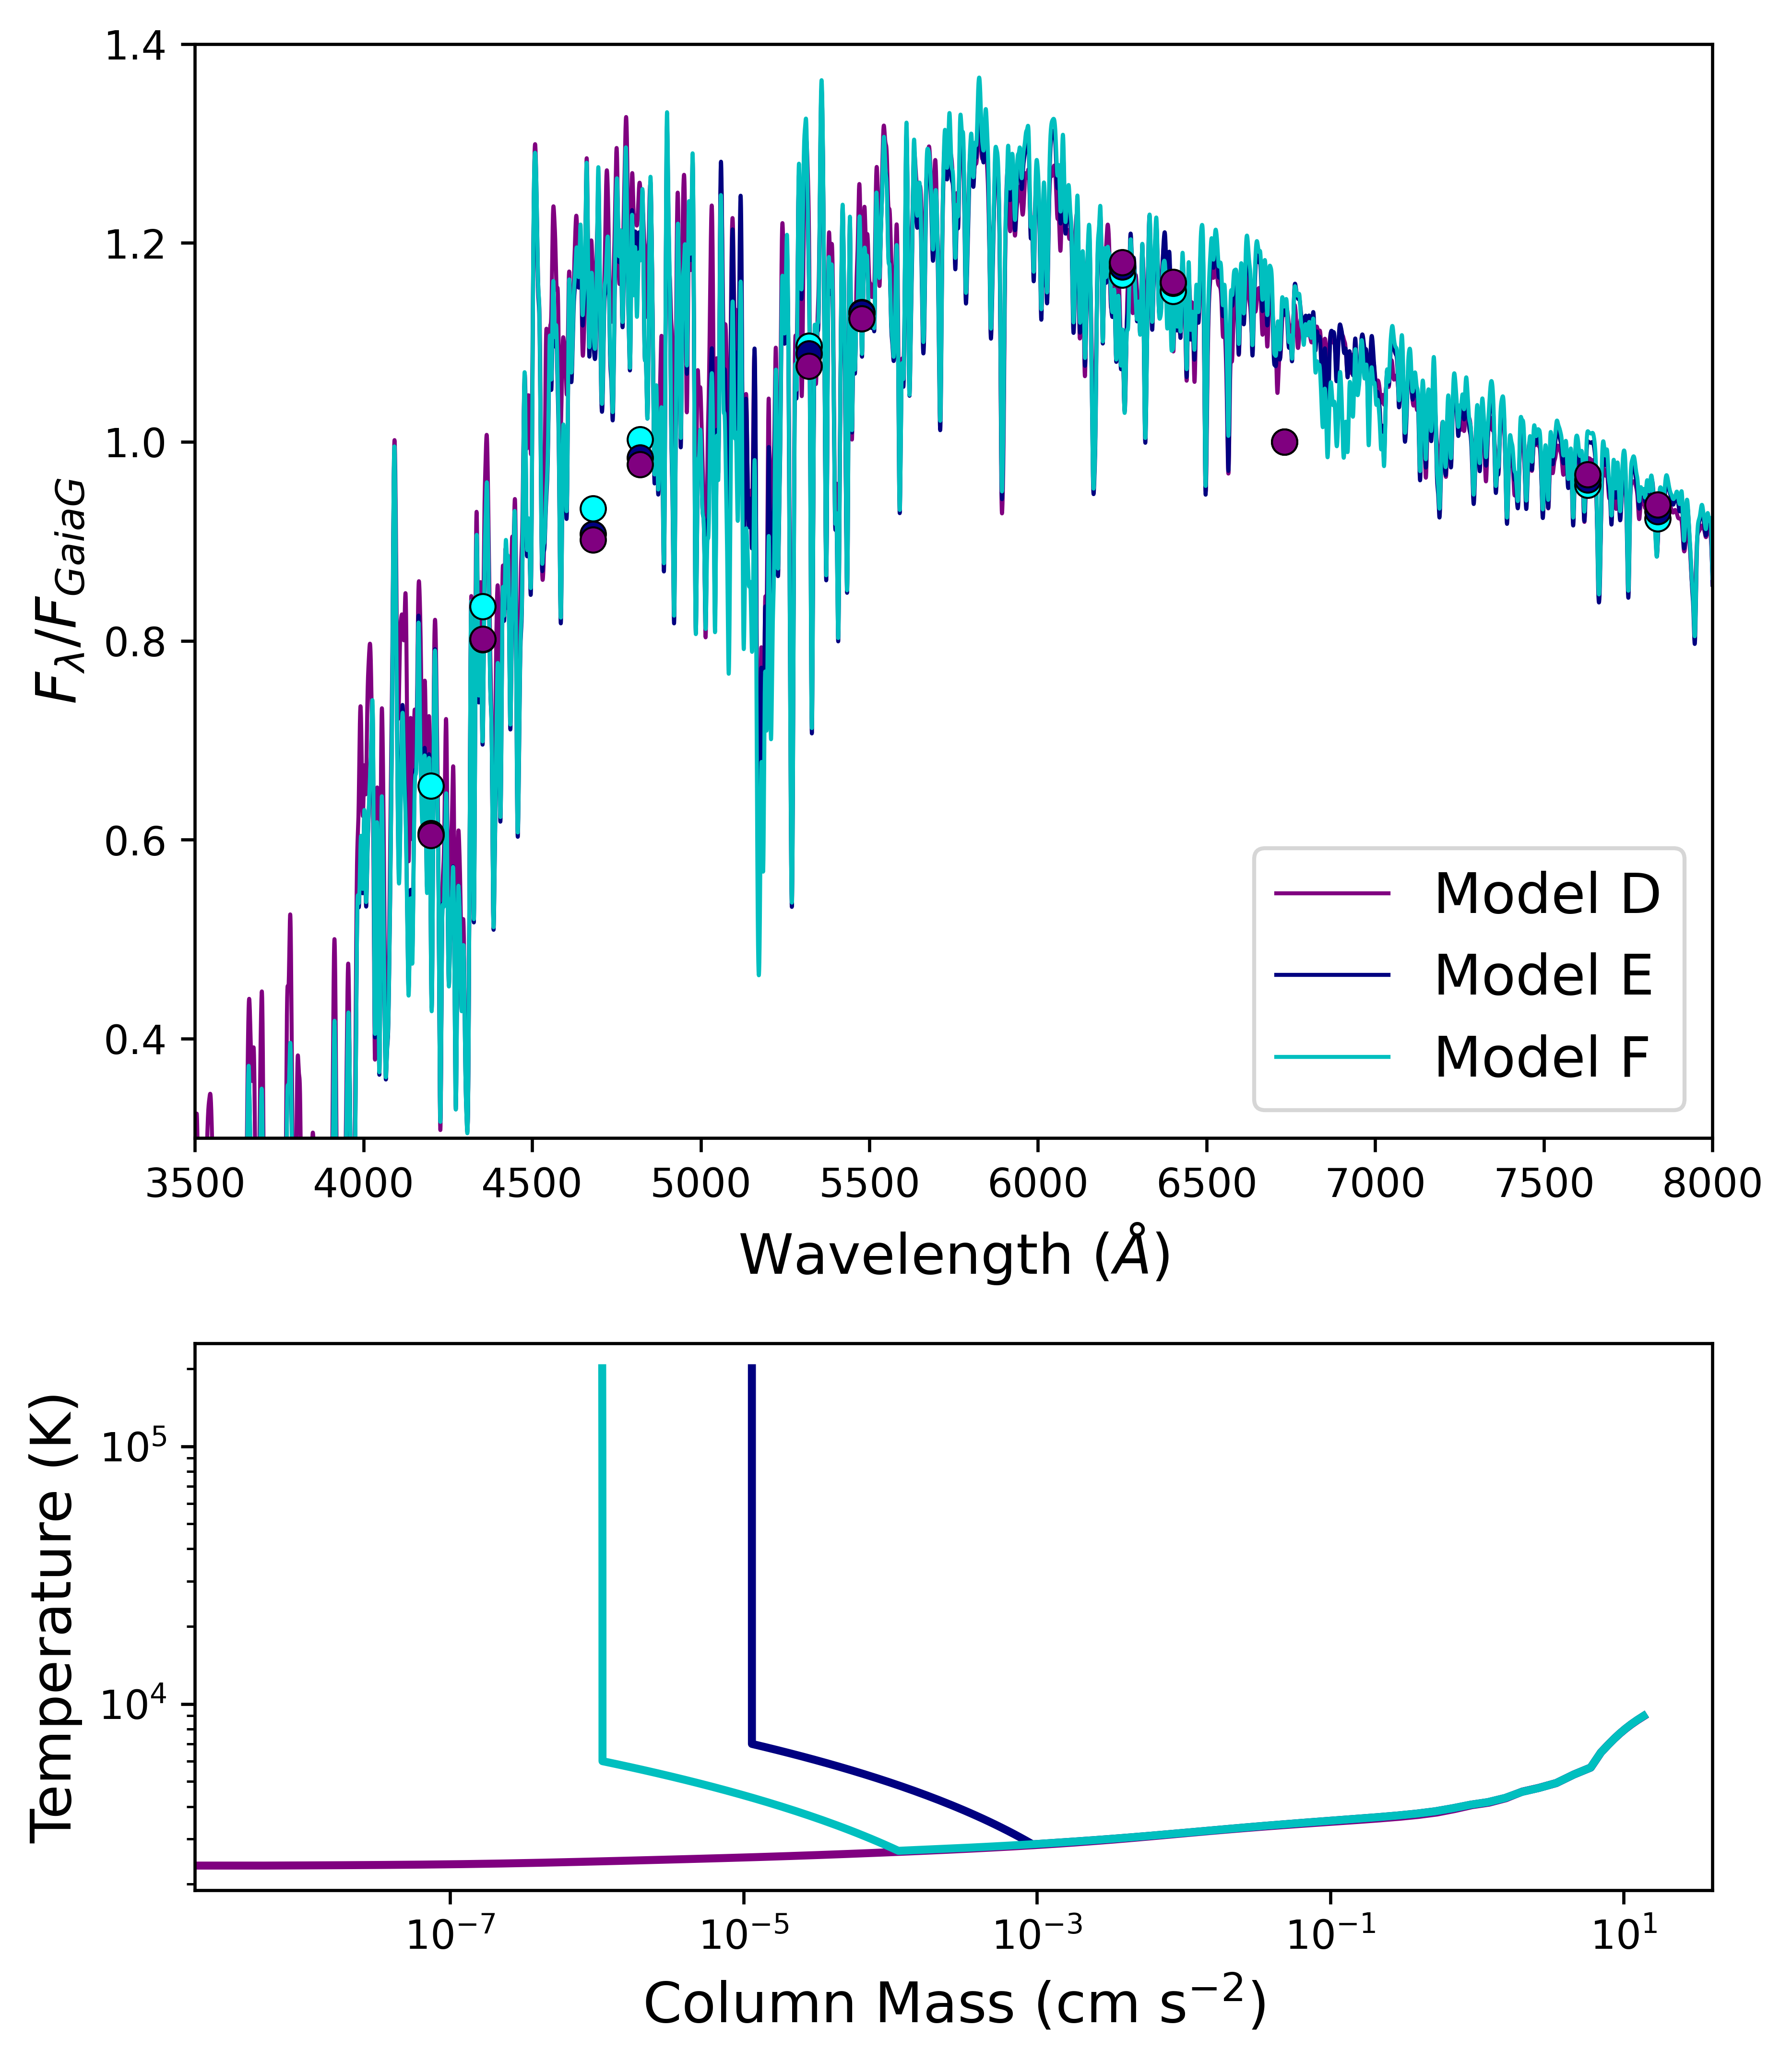
The spectra models I run are used to constrain the photospheric parameters with empirical guidance from visible and IR photometry, however, it is necessary to include an upper atmosphere because there is flux contribution from chromospheric emission lines in the visible bands e.g. Ca II h and k lines (3934.77 Å, 3969.59 Å), Na I D doublet (5897.56 Å, 5891.58 Å), and Hα (6564.62 Å). Essentially, adding the chromosphere and transition region into the spectra makes the spectra more accurate (non-LTE physics) which makes my calculations comparing the models to the observations more accurate. Shown below are the synthetic spectra for two stars (a 5000 K star in pink and a 3000 K star in blue) with the upper atmosphere added and the temperature structure of each model shown in the bottom of the plot. “TR” stands for Transition Region, the region above the chromosphere. The upper panel shows a comparison of three stellar spectra: Model A, computed assuming LTE ("photosphere only"), Model B, with a non-LTE, high activity chromosphere and finally, Model C, with a non-LTE, low activity chromosphere. The lower panel shows the temperature structure with column mass corresponding in color to the three model spectra in the upper left figure. The bottom image shows the same comparisons for a star with T = 5000 K. The model spectra are shown from 3500 A - 8000 A with flux density normalized to the Gaia G band. For M and G stars alike, the presence of an upper atmosphere significantly affects the visible photometry, but the differences between the high- and low-activity upper atmospheres are negligible.
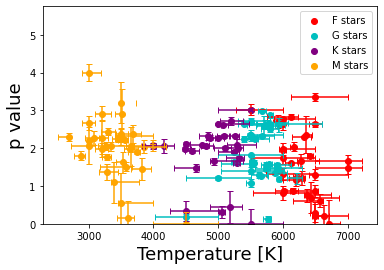
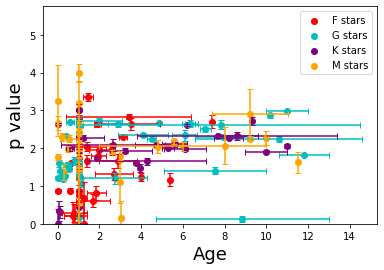
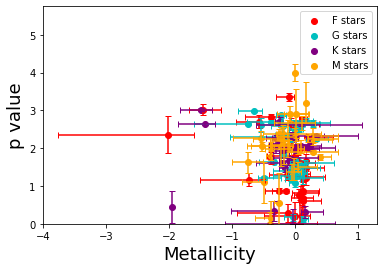
Inital Impressions of Correlations
The images below show some correlation plots between my refined stellar parameters from "photosphere-only" models grouped by spectral type. We have not come to any conclusions yet but see some correlations. I am, of course, still working on further refining the stellar parameters by using my current ranges to refine my models with added upper atmospheres, which will also produce more accurate spectra.
How I Rule Out Photometric Data
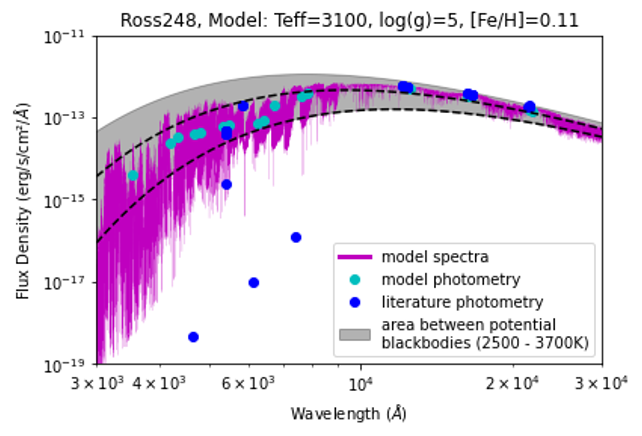
In addition to a wide range of literature values for the stellar parameters, the archival photometric data for a particular star was occasionally inconsistent, too (figure below). To rule out apparent outliers in the archival photometry, I plotted and shaded the range between blackbody curves of the minimum and maximum of the literature-quoted temperature range of the star and ruled out any points below the bottom dotted line in my χ2 calculations.