Quick Start
The first step is downloading the Beginner VH-1 code to your computer, which you can do from this link -> VH-0.5.
You can also download the full code set, VH-1, and use the Beginner code there. The only difference is the directory structure; see the Codes page for a description.
On your computer, create a clean directory with the command mkdir your_directory_name. Use either mv or cp to put VH0.5.tar into the directory. Unpack the tar file with the command tar -xvf VH0.5.tar.
If all went well you should see the following files/directories in your directory (along with VH0.5.tar):
- indat
- Makefile
- PPMLR, a directory
- vhone.f90
The workflow for the vast majority of problems you'll face when using VH-1 can be distilled into five steps:
- Edit vhone.f90 (and other files) to reflect the specific problem you're simulating.
- Compile the code using make
- Edit indat as needed to make sure your simulation evolves as long as you want it to.
- Run the executable file vhone
- Plot the output for analysis
VH-0.5 comes preset to evolve the Sod shock tube problem, so you can bypass step 1 for a quick start.
To compile VH-0.5, type make. Compiling will create several new files in the directory: you will see some object files (*.o), a few modules (*.mod), and an executable binary named vhone. Important note: as released, Makefile uses the gfortran compiler; if your computer is using a different compiler, you should change the "F90" and "LDR" flags in Makefile to reflect the compiler you use.
The next step is to edit indat to control how many time steps the simulation will evolve and how often to output data. The copy that comes with VH-0.5 should have endtime set to 2.1e-01, and tprin set to 2.0e-02. This will result in 10 output files over the course of the run, but you can edit it to output more or fewer files.
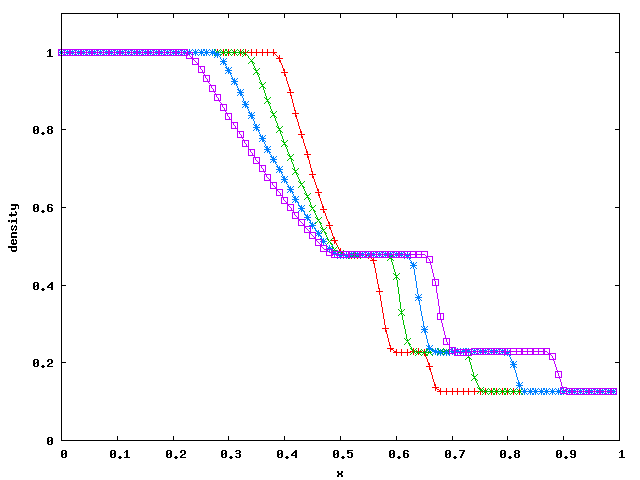
With indat configured, you can run VH-1. Type vhone (or ./vhone if required) to run the simulation and evolve the Sod shock tube. This simple problem should take less than a second to finish. Once VH-1 finishes, typing ls will show you that VH-1 did indeed generate 10 output files as part of the simulation: DATAa1000.dat to DATAa1009.dat. Each of these files is a text file containing grid values for location, density, pressure, and velocity (in column order from left to right). There is also a history file, DATAahst, which contains details about the run.
Since the .dat files are formatted text, they may be plotted with whatever
package you prefer. As an example, type gnuplot at the command prompt, and
then type
gnuplot> plot 'DATAa1005.dat' w lp, 'DATAa1007.dat' w lp, 'DATAa1009.dat' w lp
to get something that looks similar (but not quite) like

At this point, you have a functional copy of VH-1 on your machine, and may proceed through the rest of this tutorial.