INTRODUCTION
This lesson is a chance for you to apply the tools you have learned to answer a
specific research question. Our problem stems from recent numerical simulations of
a relatively simple dynamical problem first addressed in 1939. At that time astronomers
had recently discovered that space was filled with gas and dust. Sir Fred Hoyle and Ralph Lyttleton
proposed that the gravitational accretion of that gas onto the Sun could enhance the power output
of the Sun and cause global warming on Earth. This problem of hydrodynamical accretion onto a
gravitating object has become known as the
Hoyle-Lyttleton problem.
Recent numerical simulations of this problem have suggested that the accretion flow is not steady, but exhibits a quasi-periodic oscillation. Anna Carr, an undergraduate physics major at Lehigh University, spent the summer of 2012 studying this oscillation phenomena using hydrodynamic simulations. An example output is shown below.
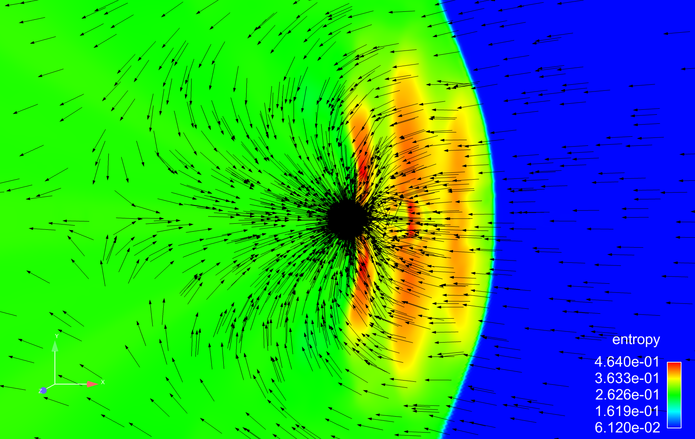
In this example, the gravitating star (in black) is moving to the right at Mach 3. The arrows show the flow velocity in the frame of the moving star. The interface between the blue (low entropy) and green (high entropy) is the bow shock that forms ahead of the star. This bow shock appears to oscillate back and forth, producing the bands of high entropy seen in red. This oscillation modulates the rate of mass accretion onto the star:
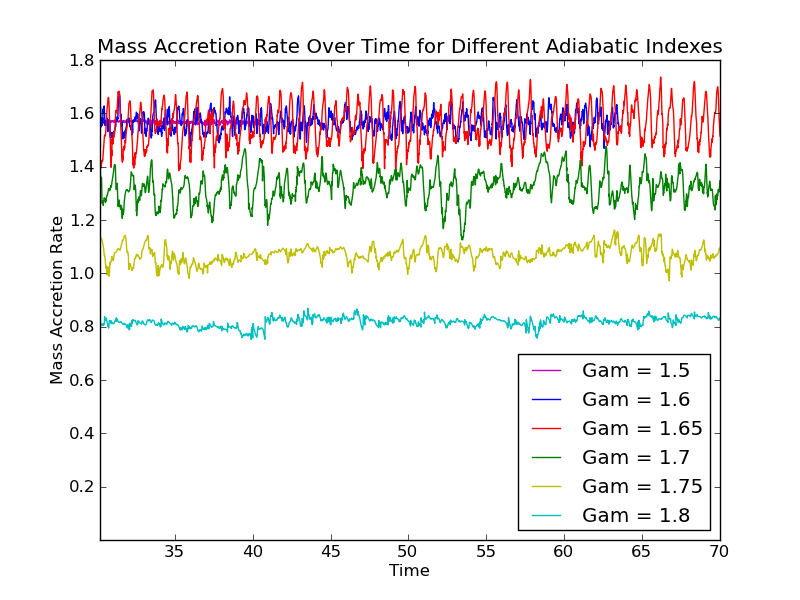
These oscillations are quasi-periodic in that there is an obvious period of oscillation, but it is not consistently harmonic. To relate this motion to the physics of accretion, one would like to have a quantitative measure of this oscillation period. For example, does it relate to the time for a sound wave to propagate from the bow shock to the star and back?
Your task for this lesson is to measure the oscillation period in this data set generated by Anna last summer and shown below.
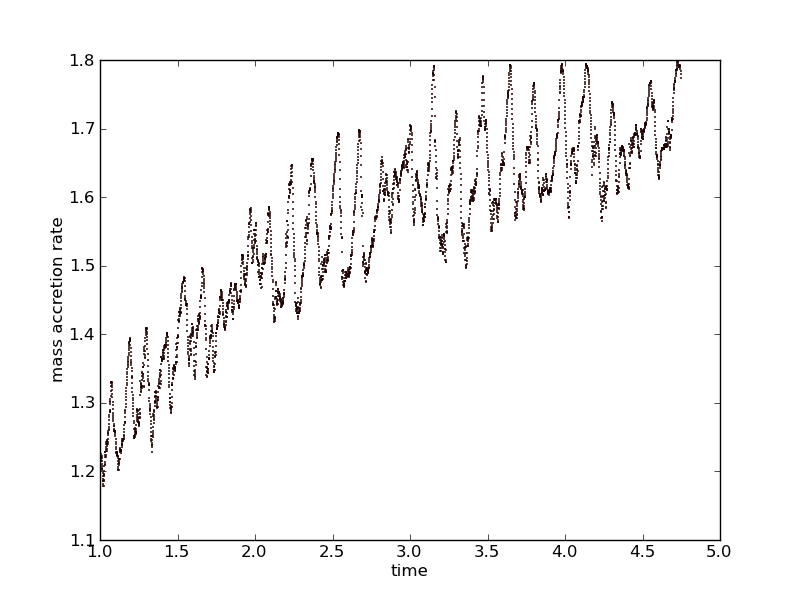
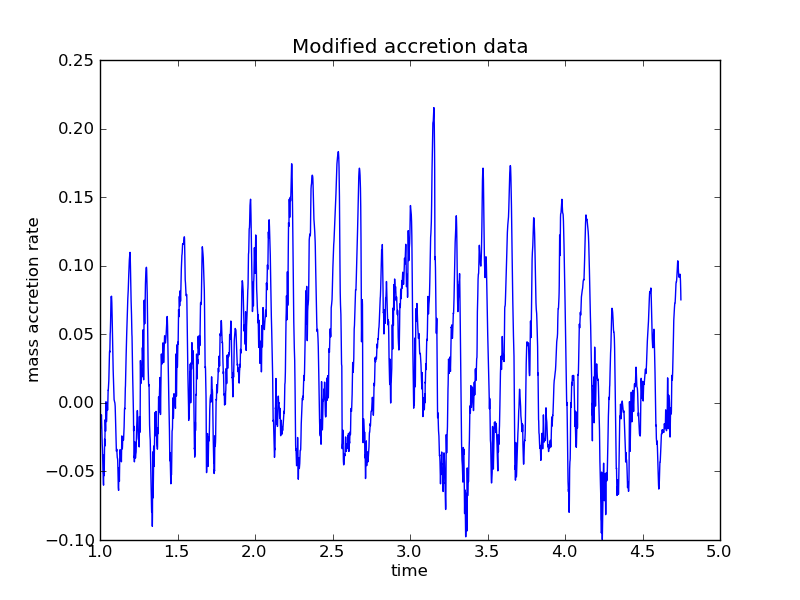
When you take the FFT of this data, you will see a lot of power at the lowest frequencies. This has to do with the gradual rise in the mass accretion rate, not with the quasi-periodic oscillation (compare the frequency with a rough estimate of the period as seen in the original data). To get a 'cleaner' signal in the power spectrum, you can modify the original data to remove this gradual rise.
Here is an example of modifying the data to remove the slow secular evolution. This still has some long-period variation to it. Can you do better? How might you make use of the data fitting capability in python introduced in Lesson 13?
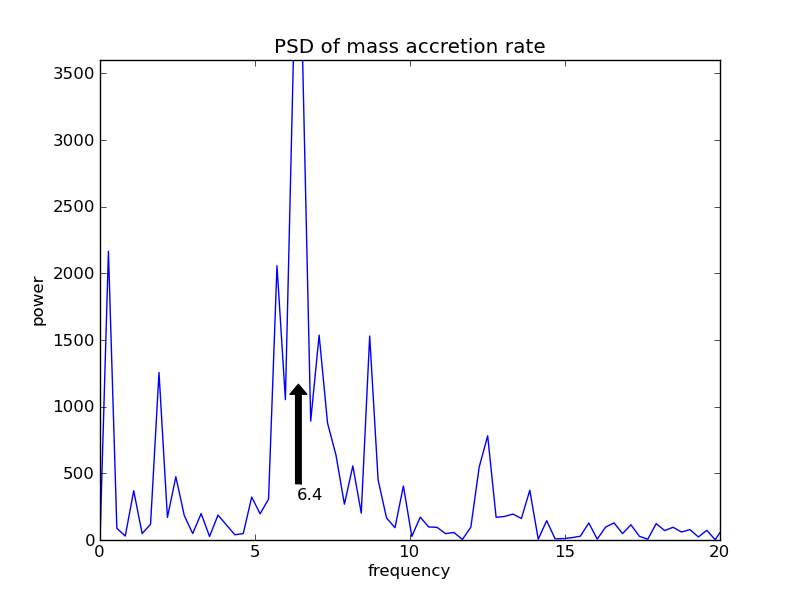
Assignment: Upload a python program that reads in Anna's data set and plots the power spectral density. Identify the frequency of the quasi-periodic oscillation.
