
INTRODUCTION
At this point you should be able to generate a reasonable Poincare map (a
phase space plot using a strobe light). What we have found is an unusual, but ordered, plot of phase space when viewed with the aid of a strobe light matching the driving frequency. However, this unusual behavior is markedly different depending on the value of the driving force. For example,
a driving force of $F_D=1.4$ leads to a single point on the phase space plot. This corresponds to
strickly periodic motion at the strobe (and driving) frequency. When there are large, continuous loops through the Poincare map, the pendulum is moving in a chaotic manner with no apparent periodicity.
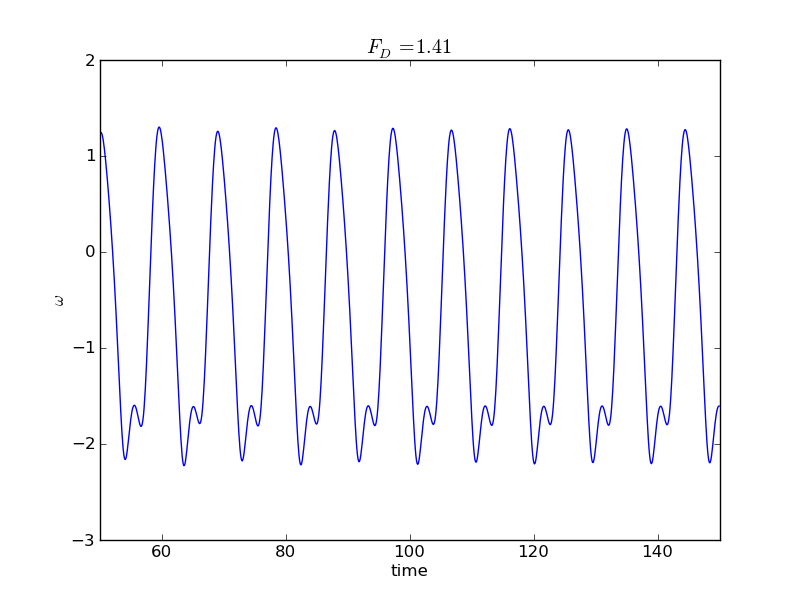
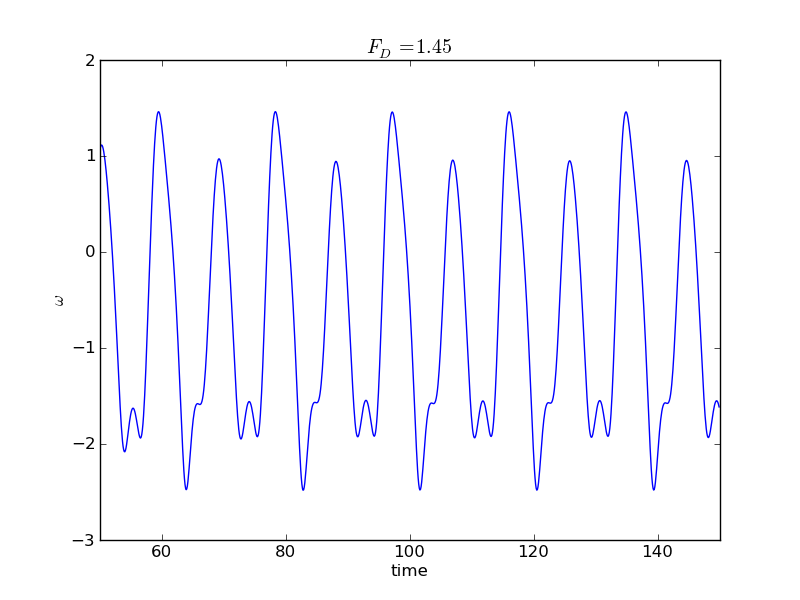
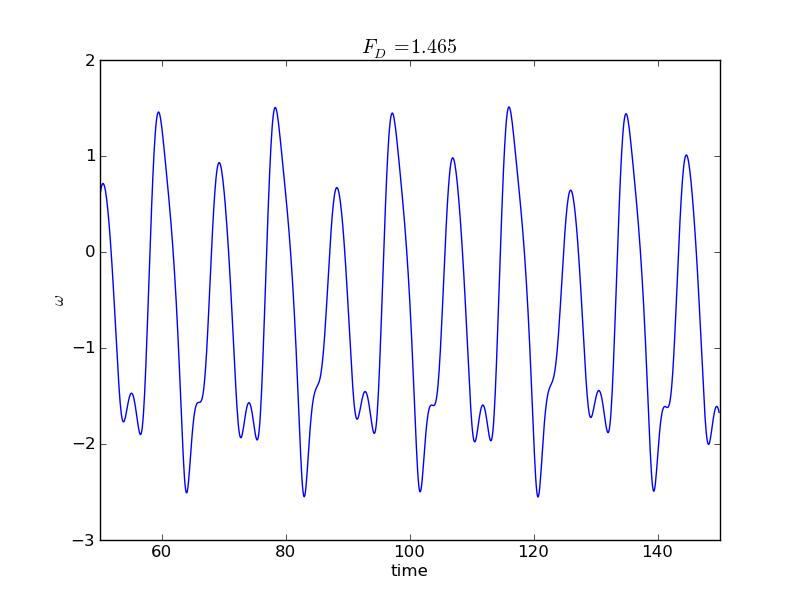
Looking closer at the periodic behavior, we see a correlation between the number of spots on the Poincare map and the period of the pendulum's swing. The following graphs plot $\omega$ versus time for different values of the driving force corresponding to one, two, and four points showing up on the Poincare map. Here we plot $\omega$ instead of $\theta$ only to avoid the jumps between $-\pi$ and $+\pi$. Note the length of period between the fully repeating patterns in each case; the period is doubling between each example.
To see this period-doubling behavior as a function of driving force, we can generate data to plot the value of $\theta$ recorded in the Poincare map as a function of the driving force. In the chaotic regime this will leave a mess, since $\theta$ can take on just about any value in the chaotic regime. In the periodic regime, however, we have seen that $\theta$ takes on only certain distinct values. We can generate such a plot by adding an outer loop to our program that cycles through values of the driving force, writing out the force and $\theta$ at many different times (still in phase with the driving force).
The structure of your program should look something like this...
- loop over values of the driving force
- set initial conditions for new simulation
- loop over many periods of the driving force
- loop over time for one period, updating $\theta(t), \omega(t)$
- store value of $\theta$ and the driving force
Bifurcation Diagram
The result is referred to as a bifurcation diagram, as it clearly illustrates the
doubling of the period. Here we show values of the driving force between 1.4 and 1.5. The region near 1.5 filled with data points, corresponding to a chaotic regime.
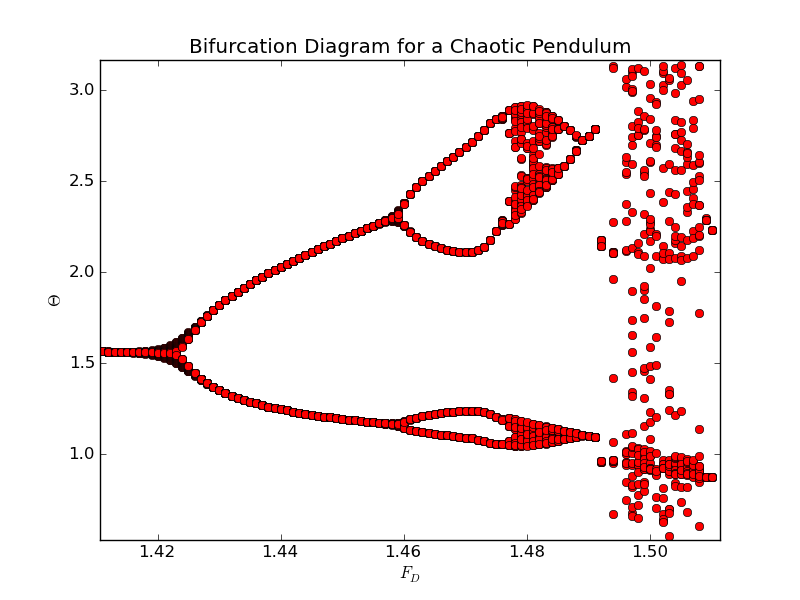
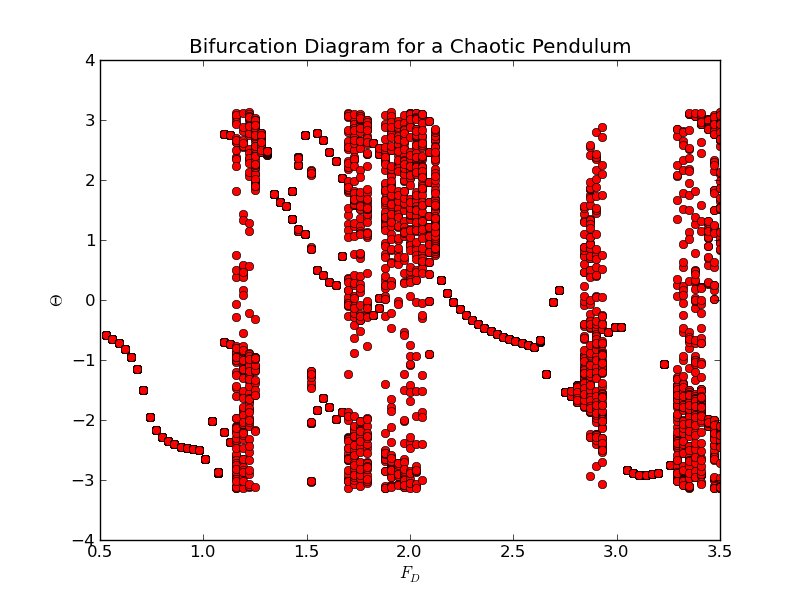
The bifurcation plot is a very handy way of identifying regions of chaos. We know from previous work that a value of $F_D=0.5$ produces periodic behaviour, while $F_D=1.2$ is chaotic. Clearly, this pendulum goes in and out of chaos for different values of the driving force. If we use our program to map out the behavior of the pendulum, we find the following results:
FEIGENBAUM DELTA
This characteristic doubling and redoubling of the period is a relatively common feature of chaos. Although it is not universal, period doubling is one of only a few ways in which a system "enters" into a chaotic regime. This common behavior prompts one to ask if there is something more "universal" about this process of period doubling. Does this represent the same physical process as in other chaotic systems that exhibit period doubling? An imperical answer to this question is given by the observation that almost all period-doubling systems can be characterized by a Feigenbaum delta of approximately 4.669.
What is the Feigenbaum delta, you ask? If we define $F_n$ as the value of the driving force when the system makes a transition to a regime of period 2n, then the Feigenbaum delta is defined as
Exercise: Modify your code to generate a bifurcation plot, and use it to plot values of $\theta$ in the vicinity of bifurcation points. Do this for at least three values of$F_n$ and estimate the Feigenbaum delta for this chaotic pendulum.

Assignment: Submit a python program that generates a bifurcation diagram showing a region in which the period is doubling.