INTRODUCTION
If chaotic systems where entirely unpredictable, you probably wouldn't have heard so much about them. Their most intruiging features are related to the fact that there are things that can be predicted about these unpredictable systems. In these next two lessons we will learn several tools for analyzing chaotic systems, with the hope of learning something about what it means to be truly chaotic.
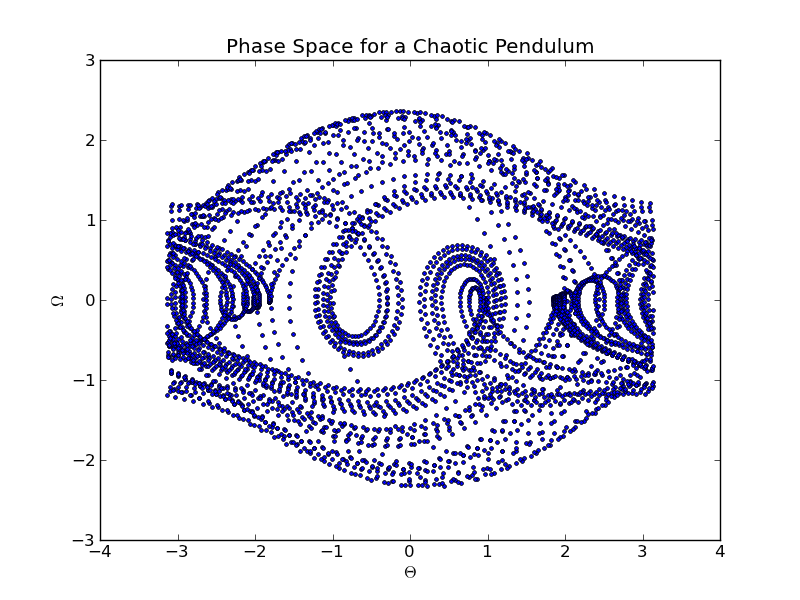
We begin with the phase space plot. We have already seen that the motion of a pendulum, when plotted as angle versus time, appears completely irregular. But when we plot that same motion as angle versus speed ($\theta$ v $\omega$), we begin to see some interesting behavior.
Before you make this plot, you need to modify your program so that theta always remains between $-\pi$ and $+\pi$. Accomplish this with if statements that subtract $2\pi$ if $\theta$ exceeds $+\pi$, and adds $2\pi$ if $\theta$ drops below $-\pi$.

This plot is interesting in that it is not completely filled in with points. The trajectory of the pendulum in this phase space is not repeating, but it does have clearly peferred paths.
Exercise: Make phase space diagrams for different values of the driving force and/or initial conditions. Do either of these parameters affect the evolution in phase space?
SAVE SOME DATA
While you have a code that generates a long time-series, use it now to save a time-series
to a data file for use in later lessons. Save time and $\omega$ (rather than $\theta$ since
the angle brings in the complication of intervals of $2\pi$.) to a text file
using the savetxt command.
savetxt('omega.dat',zip(time,omega))
Here the zip function 'zips' together the two one-dimensional arrays so that the output written to the file omega.dat is in two column format rather than all the times followed by all the omegas.

STROBE LIGHT
Our next tool is a strobe light. A convenient way to "slow down" rapid motion is to only look at fixed intervals of time. A strobe light does this by lighting up the moving object at specified frequency. If you light up a rotating object using a strobe frequency that matches the rotational frequency, you only see it at a fixed point in its rotation; it looks like it is standing still.
We can use this method in our numerical program by writing out the position and velocity information at a fixed frequency rather than every at every timestep. The two frequencies in our problem are the natural frequency of the pendulum and the driving frequency. For strong driving, which is the regime that leads to chaos, the driving term dominates and we expect the driving frequency to dominate.
To add a strobe light to your program, add a new time variable that you can use to keep track of when to store the data to an array for later plotting. Once this time counter has reached the strobe period, store the value of theta and omega and reset the time counter. (You no longer need to keep all values of theta in an array.) But be careful! Why won't the following code work as an accurate strobe over long periods of time?
strobe = 2.0*pi / Omega
while (time < endtime):
    time = time + dt
    theta =
    omega =

    strobe_time = strobe_time + dt
    if (strobe_time >= strobe_period):
        strobe_time = 0.0
        Stheta[n] = theta
        Somega[n] = omega
        n += 1
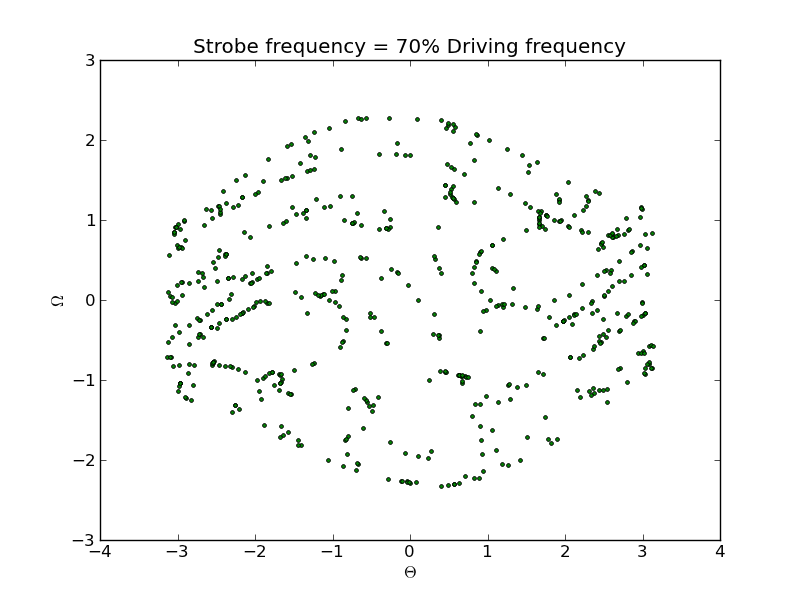
The first plot below is a strobe-light phase-space diagram, but with a strobe frequency that is only 70% of the driving frequency. The result is not very useful, just like using a strobe light to illuminate an object rotating at a frequency that differs from the strobe frequency.

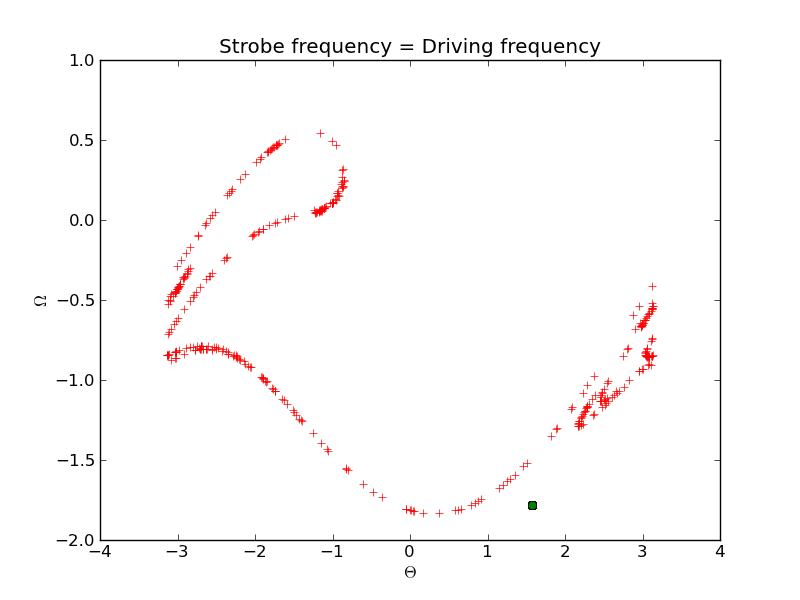
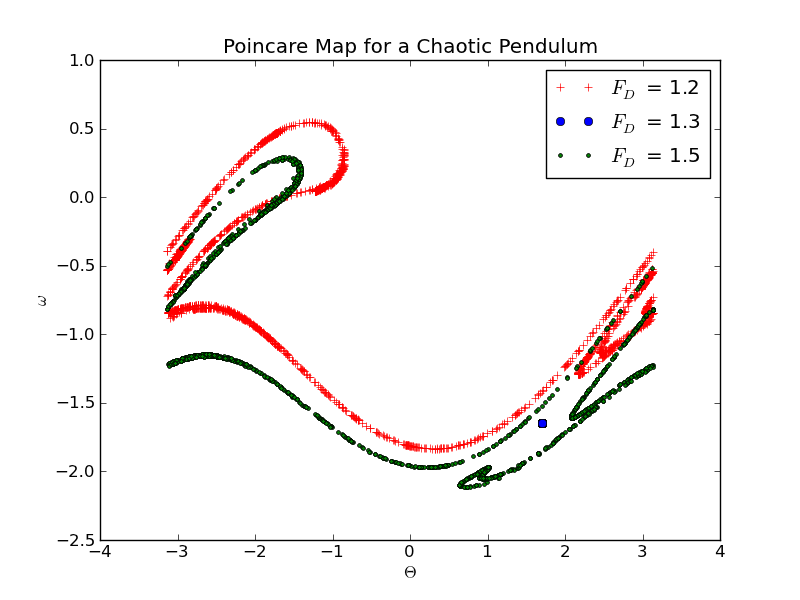
The following plot, known as a Poincare map, shows the same phase space diagram, but now only including points that are "in phase" with the driving force. The strobe frequency is matched to the driving frequency. Points are shown for two different values of the driving force. The red points are for $F_D = 1.2$ corresponding to a chaotic regime, and the green dot is for $F_D = 1.4$, for which the pendulum simply follows the driving frequency at a fixed amplitude In this later case the strobe has the effect of making the pendulum 'stand still.'

Assignment: Submit a python program that creates a Poincare map for a chaotic pendulum
